Samenvatting Experimenteel en Correlationeel Onderzoek
Leary hoofdstuk 7, Howell hoofdstuk 9 en 10; correlaties en maten voor effectgrootte
Correlatiematen:
Pearson r: kwantitatief + kwantitatief; Sxy / Sx Sy covariantie delen door sd van x en y
Spearman rho rs: ordinaal + ordinaal; ∑(rXi-Xgem)/S x (rYi-Ygem)/S = ∑ ZxZy/N-1
Rangscore per participant – gemiddelde rangscores delen door sd
Xgem van rangscore = N+1/2 en S van rangscore = √N(N+1)/12
punt-biseriële correlatie rpb: dichotoom + kwantitatief; √t2/t2+df
phi coëfficiënt ᴓ: dichotoom + dichotoom; 2x2-kruistabel
AD – BC / √(A+B)(C+D)(A+C)(B+D)
schuin in tabel / marginale totale
Kwantitatief; getalswaarde (interval of ratio meetniveau)
Ordinaal; verschillende categorieën zonder vaste waarde tussen categorieën
Dichotoom; variabele heeft maar twee mogelijkheden
Covariantie (Sxy); ∑(Xi - Xgem)(Yi - Ygem)/N-1 standaardiseren met pearson r
Relatie tussen de waarde van ᴓ en X2 in een 2x2-kruistabel;
ᴓ = √X2/N of X2 = ᴓ2 x N
Relatie tussen rpb en t; r2pb = t2/(t2 + df)
Radj ; 1/N-1 x ∑ (Xi-Xgem)/Sx x (Yi-Ygem)/Sy = ∑ ZxZy/N-1
Assumpties voor toetsen van correlatiecoëfficiënt;
- Homogeniteit van varianties; variantie van Y bij elke waarde van X gelijk
- Normale verdeling van Y bij X rond Ydak
- Relatie tussen X en Y is lineair
Hypothese voor correlatiecoëfficiënt; H0: p=0 en Ha: p>0
Effectgrootte; r2 proportie verklaarde variantie (VAF) om te interpreteren en vergelijken
Interpreteren;
r, p en ᴓ .10 .30 .50
r2.01 .09 .25
rpb .10 .24 .37
r2pb .01 .06 .14
significantietoetsing; t = (r√N-2)/(√1-r2) met df = N-2
Leary hoofdstuk 8 en Howell hoofdstuk 9; enkelvoudige lineaire regressie
Regressie; een variabele voorspellen uit één of meer variabelen
Regressielijn; lijn in scatterplot om verband aan te geven, gaat altijd door (Xgem, Ygem) en
(0, b0)
, Enkelvoudige lineaire regressieanalyse; 1 predictor variabele
Ydak = b0 + b1 X voorspelde waarde
b = ruwe scores b* = gestandaardiseerde scores β = populatie scores
b0 = constante voorspelde waarde van y bij x=0 Ӯ – b1 Xgem
b1 =slope verschil in Ydak als X veranderd r Sy/Sx
predictor variabele; onafhankelijk
response variabele; afhankelijk
enkelvoudig regressiemodel/vergelijking;
populatie; µy = β0 + β1X met Ꝺ
steekproef ; t = b1/SE met df = N-P-1 en SE= se/sx√N-1
standaardiseren; Zdaky = b*0 + b*1Zx rZx met b*0=0 en b*1=r
residu; geobserveerd – voorspeld; ei = y – ydak
standaard error ; Syx = √∑(Y-Ydak)2/N-2
SSy = SSYdak + SSe met df = N-P-1
MSy = ∑ (Y-Ӯ)2/N-1 totale variantie
MSe = ∑ (Y-Ydak)2/N-P-1 error variantie
Se = √MSe
MS = mean square variantie in regressiemodel van gemiddelde van gekwadrateerde
afwijking
S = standaarddeviatie
S2 = variantie
SST/N-1 = S2
Betrouwbaarheidsinterval regressiegewicht;
b1 +- t* SE met df = N-p-1
Howell hoofdstuk 15; meervoudige lineaire regressie
Meervoudige regressieanalyse ; meer predictoren
Ydak = b0 + b1X1 + b2X2 +…..
Populatie ; µy = β0 + β1X1 + β2X2 + …
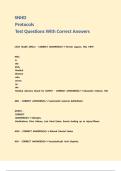
Semi-partiële correlatie ; overlap in de predictoren
A en C zijn unieke bijdrage, B is overlap
A+B+C = VAF
r0(1,2)= √A/D+A+B+C correlatie y met unieke bijdrage X1
r(2,1)= √C/D+A+B+C correlatie y met unieke bijdrage X2
kwadrateren om VAF van semi-partiële correlatie te krijgen
Leary hoofdstuk 7, Howell hoofdstuk 9 en 10; correlaties en maten voor effectgrootte
Correlatiematen:
Pearson r: kwantitatief + kwantitatief; Sxy / Sx Sy covariantie delen door sd van x en y
Spearman rho rs: ordinaal + ordinaal; ∑(rXi-Xgem)/S x (rYi-Ygem)/S = ∑ ZxZy/N-1
Rangscore per participant – gemiddelde rangscores delen door sd
Xgem van rangscore = N+1/2 en S van rangscore = √N(N+1)/12
punt-biseriële correlatie rpb: dichotoom + kwantitatief; √t2/t2+df
phi coëfficiënt ᴓ: dichotoom + dichotoom; 2x2-kruistabel
AD – BC / √(A+B)(C+D)(A+C)(B+D)
schuin in tabel / marginale totale
Kwantitatief; getalswaarde (interval of ratio meetniveau)
Ordinaal; verschillende categorieën zonder vaste waarde tussen categorieën
Dichotoom; variabele heeft maar twee mogelijkheden
Covariantie (Sxy); ∑(Xi - Xgem)(Yi - Ygem)/N-1 standaardiseren met pearson r
Relatie tussen de waarde van ᴓ en X2 in een 2x2-kruistabel;
ᴓ = √X2/N of X2 = ᴓ2 x N
Relatie tussen rpb en t; r2pb = t2/(t2 + df)
Radj ; 1/N-1 x ∑ (Xi-Xgem)/Sx x (Yi-Ygem)/Sy = ∑ ZxZy/N-1
Assumpties voor toetsen van correlatiecoëfficiënt;
- Homogeniteit van varianties; variantie van Y bij elke waarde van X gelijk
- Normale verdeling van Y bij X rond Ydak
- Relatie tussen X en Y is lineair
Hypothese voor correlatiecoëfficiënt; H0: p=0 en Ha: p>0
Effectgrootte; r2 proportie verklaarde variantie (VAF) om te interpreteren en vergelijken
Interpreteren;
r, p en ᴓ .10 .30 .50
r2.01 .09 .25
rpb .10 .24 .37
r2pb .01 .06 .14
significantietoetsing; t = (r√N-2)/(√1-r2) met df = N-2
Leary hoofdstuk 8 en Howell hoofdstuk 9; enkelvoudige lineaire regressie
Regressie; een variabele voorspellen uit één of meer variabelen
Regressielijn; lijn in scatterplot om verband aan te geven, gaat altijd door (Xgem, Ygem) en
(0, b0)
, Enkelvoudige lineaire regressieanalyse; 1 predictor variabele
Ydak = b0 + b1 X voorspelde waarde
b = ruwe scores b* = gestandaardiseerde scores β = populatie scores
b0 = constante voorspelde waarde van y bij x=0 Ӯ – b1 Xgem
b1 =slope verschil in Ydak als X veranderd r Sy/Sx
predictor variabele; onafhankelijk
response variabele; afhankelijk
enkelvoudig regressiemodel/vergelijking;
populatie; µy = β0 + β1X met Ꝺ
steekproef ; t = b1/SE met df = N-P-1 en SE= se/sx√N-1
standaardiseren; Zdaky = b*0 + b*1Zx rZx met b*0=0 en b*1=r
residu; geobserveerd – voorspeld; ei = y – ydak
standaard error ; Syx = √∑(Y-Ydak)2/N-2
SSy = SSYdak + SSe met df = N-P-1
MSy = ∑ (Y-Ӯ)2/N-1 totale variantie
MSe = ∑ (Y-Ydak)2/N-P-1 error variantie
Se = √MSe
MS = mean square variantie in regressiemodel van gemiddelde van gekwadrateerde
afwijking
S = standaarddeviatie
S2 = variantie
SST/N-1 = S2
Betrouwbaarheidsinterval regressiegewicht;
b1 +- t* SE met df = N-p-1
Howell hoofdstuk 15; meervoudige lineaire regressie
Meervoudige regressieanalyse ; meer predictoren
Ydak = b0 + b1X1 + b2X2 +…..
Populatie ; µy = β0 + β1X1 + β2X2 + …
Semi-partiële correlatie ; overlap in de predictoren
A en C zijn unieke bijdrage, B is overlap
A+B+C = VAF
r0(1,2)= √A/D+A+B+C correlatie y met unieke bijdrage X1
r(2,1)= √C/D+A+B+C correlatie y met unieke bijdrage X2
kwadrateren om VAF van semi-partiële correlatie te krijgen