GLOBAL TRENDS IN CONSUMPTION
Global and regional progress towards poverty reduction
● Extreme poverty - living on less than $1.25 a day
● Middle class - (definitions vary) according to OECD: people living on between $10 and $100
a day
● Under the MDGs, substantial progress towards eradicating poverty was made
○ In 1990, 43% of people in developing regions lived on less than $1.25 a day; by 2015,
this rate dropped to 14%. In absolute terms, the target to reduce extreme poverty
by half between 1990 and 2015 was met five years ahead of schedule
○ The share of the global population in poverty had been declining for centuries. It was
only in the 1990s that the absolute number of people in poverty started declining
○ Most regions noted a decrease in the number of people living in extreme poverty,
■ In East Asia, the number of people in extreme poverty decreased from 1
billion to 50 million
■ Sub-Saharan Africa was the only region where poverty increased - the
number of people living in extreme poverty more than doubled, from 200
million to 450 million
● Yet, there are still 800 million people living in extreme poverty
Growth of the “new global middle class”
● There are 3.7 billion people in
the global middle class, including
2 billion in Asia, 0.7 billion in
Europe and 0.3 billion in North
America
● The size of the middle class
almost trebled in 1990-2015,
and doubled between 2009 and
2020
○ In 1990, the middle class
accounted for 18% of
LIC’s population; in 2015, this proportion was up to nearly 50%
● The increasing number of the members of the middle class is important economically, as it
means an ever-increasing number of people can afford phones, cars and luxurious services
○ Cars sales have risen eight-fold since 2009
● By 2030, the middle class will more than double in size, reaching 4.9 billion
○ By 2030, Asia will host 64% of the global middle class and account for over 40% of
global middle-class consumption
, ● Growth on individual level is not guaranteed: in the 1980s, Brazil and South Korea had
similar proportions of middle class in their population, but today South Korea’s middle class
accounts for 50% of the population while in Brazil that proportion is just 30%
Measuring trends in resource consumption
Ecological footprint - the hypothetical area
of land needed to fulfil one’s resource
needs and accommodate all their waste
under prevailing technology (expressed in
global hectares)
● The largest and fastest growing
component of the global
ecological footprint is carbon.
Second, both in terms of total
contributions and growth rate, is
cropland
● The Earth’s biocapacity is 1.7 gha
per capita; the global ecological
footprint is 2.2 gha per capita
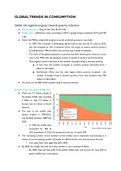
● Global ecological footprint
exceeded the Earth’s biocapacity in 1970, but the global ecological footprint continues to
grow. The UN projects that by 2030, two Earths would be needed to supply all demanded
resources and accommodate all waste.
Carbon footprint - GHG emissions by person/ country/ event etc. expressed as CO 2 equivalent
Biocapacity - capacity of a given area to generate an ongoing supply of renewable resources and to
absorb its waste
How can ecological footprint be reduced?
➔ Reducing the use of fossil fuels
◆ Switching to energy generation from renewable energy sources
◆ Changing travel habits to those using less hydrocarbons: switching from private cars
to bikes, public transport or carsharing; limiting the amount of air travel
➔ Reducing consumption of animal products (since animals only convert only 10% of the food
they eat into new biomass)
➔ Reducing the amount of energy used by technology by reducing the use of technology or
using more energy-efficient technology
➔ Recycling, reusing and reducing resources
◆ In LICs, the informal economy is responsible for much recycling
➔ Reducing the amount of goods imported (that generate CO2 when transported)
, ➔ Using GM crops to obtain higher yields from the same area of land
Global patterns and trends in the availability and consumption
Renewable energy - energy the source of which can be replenished within a human lifetime
Water
● Only 3% of water on Earth is freshwater; ⅔ of this is frozen
● 780 million people do not have access to clean water; 1 million people die every year due to
clean water shortages
● By 2050, demand for water will increase by 55%
○ Demand for water is increasingly strained by growing population, growth of the
middle class (which can afford more goods) changing dietary habits into higher meat
consumption, growth of tourism and recreation (eg. golf courses), and increasing
demand for water for hydroelectric plants
● Climate change is expected to lower water availability in many regions, eg. Central and
Southern Europe and sub-Saharan Africa, which will become drier
● The average North American consumes three times as much water as an African and twice
as much as an Asian
Embedded water - water involved in the growing and manufacturing of products (such as food,
materials, manufactured goods) in one place that are transferred to other, often water scarce, places
via trading
● Allows countries with scarce water resources to benefit from water-intensive goods (since
water itself is difficult to transport) and allows countries to save their own water resource
while benefiting from others’
● Examples: 1l milk = 683l virtual water
450g plastic = 91l virtual water
450g paper = 148l virtual water
a smartphone = 12,491l virtual water
a car = 14,763l virtual water
Global and regional progress towards poverty reduction
● Extreme poverty - living on less than $1.25 a day
● Middle class - (definitions vary) according to OECD: people living on between $10 and $100
a day
● Under the MDGs, substantial progress towards eradicating poverty was made
○ In 1990, 43% of people in developing regions lived on less than $1.25 a day; by 2015,
this rate dropped to 14%. In absolute terms, the target to reduce extreme poverty
by half between 1990 and 2015 was met five years ahead of schedule
○ The share of the global population in poverty had been declining for centuries. It was
only in the 1990s that the absolute number of people in poverty started declining
○ Most regions noted a decrease in the number of people living in extreme poverty,
■ In East Asia, the number of people in extreme poverty decreased from 1
billion to 50 million
■ Sub-Saharan Africa was the only region where poverty increased - the
number of people living in extreme poverty more than doubled, from 200
million to 450 million
● Yet, there are still 800 million people living in extreme poverty
Growth of the “new global middle class”
● There are 3.7 billion people in
the global middle class, including
2 billion in Asia, 0.7 billion in
Europe and 0.3 billion in North
America
● The size of the middle class
almost trebled in 1990-2015,
and doubled between 2009 and
2020
○ In 1990, the middle class
accounted for 18% of
LIC’s population; in 2015, this proportion was up to nearly 50%
● The increasing number of the members of the middle class is important economically, as it
means an ever-increasing number of people can afford phones, cars and luxurious services
○ Cars sales have risen eight-fold since 2009
● By 2030, the middle class will more than double in size, reaching 4.9 billion
○ By 2030, Asia will host 64% of the global middle class and account for over 40% of
global middle-class consumption
, ● Growth on individual level is not guaranteed: in the 1980s, Brazil and South Korea had
similar proportions of middle class in their population, but today South Korea’s middle class
accounts for 50% of the population while in Brazil that proportion is just 30%
Measuring trends in resource consumption
Ecological footprint - the hypothetical area
of land needed to fulfil one’s resource
needs and accommodate all their waste
under prevailing technology (expressed in
global hectares)
● The largest and fastest growing
component of the global
ecological footprint is carbon.
Second, both in terms of total
contributions and growth rate, is
cropland
● The Earth’s biocapacity is 1.7 gha
per capita; the global ecological
footprint is 2.2 gha per capita
● Global ecological footprint
exceeded the Earth’s biocapacity in 1970, but the global ecological footprint continues to
grow. The UN projects that by 2030, two Earths would be needed to supply all demanded
resources and accommodate all waste.
Carbon footprint - GHG emissions by person/ country/ event etc. expressed as CO 2 equivalent
Biocapacity - capacity of a given area to generate an ongoing supply of renewable resources and to
absorb its waste
How can ecological footprint be reduced?
➔ Reducing the use of fossil fuels
◆ Switching to energy generation from renewable energy sources
◆ Changing travel habits to those using less hydrocarbons: switching from private cars
to bikes, public transport or carsharing; limiting the amount of air travel
➔ Reducing consumption of animal products (since animals only convert only 10% of the food
they eat into new biomass)
➔ Reducing the amount of energy used by technology by reducing the use of technology or
using more energy-efficient technology
➔ Recycling, reusing and reducing resources
◆ In LICs, the informal economy is responsible for much recycling
➔ Reducing the amount of goods imported (that generate CO2 when transported)
, ➔ Using GM crops to obtain higher yields from the same area of land
Global patterns and trends in the availability and consumption
Renewable energy - energy the source of which can be replenished within a human lifetime
Water
● Only 3% of water on Earth is freshwater; ⅔ of this is frozen
● 780 million people do not have access to clean water; 1 million people die every year due to
clean water shortages
● By 2050, demand for water will increase by 55%
○ Demand for water is increasingly strained by growing population, growth of the
middle class (which can afford more goods) changing dietary habits into higher meat
consumption, growth of tourism and recreation (eg. golf courses), and increasing
demand for water for hydroelectric plants
● Climate change is expected to lower water availability in many regions, eg. Central and
Southern Europe and sub-Saharan Africa, which will become drier
● The average North American consumes three times as much water as an African and twice
as much as an Asian
Embedded water - water involved in the growing and manufacturing of products (such as food,
materials, manufactured goods) in one place that are transferred to other, often water scarce, places
via trading
● Allows countries with scarce water resources to benefit from water-intensive goods (since
water itself is difficult to transport) and allows countries to save their own water resource
while benefiting from others’
● Examples: 1l milk = 683l virtual water
450g plastic = 91l virtual water
450g paper = 148l virtual water
a smartphone = 12,491l virtual water
a car = 14,763l virtual water