

Escrito por estudiantes que aprobaron Inmediatamente disponible después del pago Leer en línea o como PDF ¿Documento equivocado? Cámbialo gratis 4,6 TrustPilot
logo-home
Document preview thumbnail
Vista previa 2 fuera de 8 páginas
Examen

CNSL503 / CNSL 503 Module 8 Statistics 2026/2027 | Portage Learning | Verified Questions & Answers | 100% Correct | Grade A

Document preview thumbnail
Vista previa 2 fuera de 8 páginas

CNSL503 / CNSL 503 Module 8 Statistics 2026/2027 | Portage Learning | Verified Questions & Answers | 100% Correct | Grade A What is the main difference between parametric and nonparametric tests? Parametric tests make assumptions based on normal distributions, whereas nonparametric tests make no assumptions about the population parameters being used. True or False: Nominal variables are described using measures of central tendency, such as the mean or median. False; Nominal variables are described by the frequency in each category of a variable. If the categorization of a nominal variable were based on random chance, what would the frequency distribution look like for that variable? The frequencies of all levels of the variable would be equal. The ________ test is used when analyzing one nominal variable, whereas the _______ test is used when analyzing the relationship between two nominal variables. goodness of fit; test for independence True or False: The steps for hypothesis testing with chi-square tests are different than those for parametric tests. False; The same four steps are used in hypothesis testing with chi-square tests. A study investigating cell phone brand preference recruits 500 participants and asks each participant for their preference of 4 choices of cell phones. What would the expected frequency be for each category? What is the df? 125 (500/4 =125); df = 3 The null hypothesis for a goodness of fit test states what? All frequencies of a particular variable are equal. The null hypothesis for a test for independence states what? The two variables are independent of one another. Which of the following is NOT one of the assumptions made in a chi-square test? The expected frequency for each category must be at least 5. 2 multiple choice options In a goodness of fit test, if the null hypothesis is not rejected, then differences between the observed and expected frequencies are most likely due to ________. Sampling Error Researchers are investigating whether watching animated tv shows is related to video game interest in adolescent children. They recruit a sample of 100 children. Which type of chi-square test should they perform? Test for independence since the relationship between two nominal variables is being studied. ______ tables are used to display frequency distributions for one nominal variable, whereas ________ tables are used to display frequency distributions for two nominal variables. frequency; contingency 3 multiple choice options The total frequencies for each column and row in a contingency table are known as ______. Marginal values 3 multiple choice options The ________ is used to measure effect size in studies with 2 x 2 tables, whereas _______ is used to measure effect size for contingency tables greater than 2 x 2. ϕ coefficient; Cramer's V 3 multiple choice options True or False: A ϕ coefficient of 0.62 indicates a moderate relationship between two variables. False; based on effect size conventions, this would be considered a strong relationship. what four assumptions does chi squared test make about data? 1) the data are reported as frequencies or counts 2) each participant can only be a member of one category 3)membership in each category is independent. 4) the expected frequency for each category must be at least 5 Define the Goodness of Fit Test Goodness of fit test measures the statistical significance of the difference between observed and expected frequencies when there is one categorical variable. __ tests make assumptions about population parameters and the data is assumed normally distributed, it is performed on numerical continuous or ratio data. Parametric tests ___ tests make no assumptions about population parameters and uses nominal/ordinal data. Nonparametric ___ data is ranked data ordinal ___ data is categorical data nominal The corresponding parametric-nonparametric test for paired sample test is ___ test Wilcoxon Test The corresponding parametric-nonparametric test for independent samples t-tests are the ___ test Mann-Whitney U Test The corresponding parametric-nonparametric test for an ANOVA test is ___ test Kruskal-Wallis Test The corresponding parametric-nonparametric test for Pearson's r is ___ test Spearman's rho ___ compares observed frequencies to expected frequencies. Provides statistical indicator for the statistical significance of the difference. Chi-square A chi-square critical region is always __ skewed right-skewed Determining df for chi square goodness of fit test k-1 where k is the number of categories 4 assumptions made about data used in chi-square analysis 1. Data is reported in frequencies 2. Each participant can only be a member of one category. Repeated measures are not possible 3. Membership in each category is independent 4. The expected frequency for each category must be at least 5 for mathematical purposes The ___ chi-square test measures the statistical significance of the difference between observed frequencies when there is one categorical variable goodness of fit The ___ chi square test measures the relationship between two categorical variables test for independence What are the null and alternative hypotheses for the chi square goodness of fit test? Ho: All proportions are equal Ha: All proportions are not equal What values do you need for the chi square critical value table? alpha and df What is the APA format for results for a goodness of fit test? In a recent survey about ___, report results of survey. The data showered that there is/not a statistically significant difference in the two variables. x^2 (df,N)=calculated x^2, p-value How to calculate expected frequency for goodness of fit test E=n/k The expected frequency calculated tells you the frequency that should result due to chance A ___ table is used for goodness of fit tests, a ___ test is used for tests for independence frequency table, contingency table What are the null and alternative hypotheses for a test for independence? Ho: There is no relationship between the two variables Ha: There is a relationship between the two variables. How do you calculate df for test for independence? df = (k1-1)(k2-1) How do you calculate expected frequency for test for independence? Calculate total for rows, columns, and all (n). E = (row total)(column total)/n -- calculate for each individual row/column. For two variables with two categories, this would equal 4 E values. APA format for test for independence The calculated x^2 value of ___ exceeded the critical value of __. Therefore, the null hypothesis is rejected. There is sufficient evidence that a relationship exists between the two variables, x^2(df,n=)= 11.069, p0.05 For a 2x2 contingency table, where each of the two variables has two categories, the ___ is used to measure effect size. phi coefficient φ For contingency tables larger than 2x2, ___ is calculated for effect size Cramers V Small effect for φ or Cramer's V (larger df) 0.04-0.07 (smaller df) Medium effect for φ or Cramer's V (larger df) 0.13-0.30 (smaller df) Large effect for φ or Cramer's V (larger df) 0.22-0.50 (smaller df) In a goodness of fit test, if the null hypothesis is not rejected, then differences between the observed and expected frequencies are most likely due to ________. Sampling error

Vista previa del contenido

https://www.stuvia.com/user/quizbit07


CNSL503 / CNSL 503 Module 8 Statistics
2026/2027 | Portage Learning | Verified Questions
& Answers | 100% Correct | Grade A


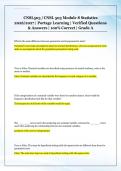
What is the main difference between parametric and nonparametric tests?

Parametric tests make assumptions based on normal distributions, whereas nonparametric tests
make no assumptions about the population parameters being used.


True or False: Nominal variables are described using measures of central tendency, such as the
mean or median.

False; Nominal variables are described by the frequency in each category of a variable.


If the categorization of a nominal variable were based on random chance, what would the
frequency distribution look like for that variable?

The frequencies of all levels of the variable would be equal.


The ________ test is used when analyzing one nominal variable, whereas the _______ test is
used when analyzing the relationship between two nominal variables.

goodness of fit; test for independence


True or False: The steps for hypothesis testing with chi-square tests are different than those for
parametric tests.

False; The same four steps are used in hypothesis testing with chi-square tests.

, https://www.stuvia.com/user/quizbit07


A study investigating cell phone brand preference recruits 500 participants and asks each
participant for their preference of 4 choices of cell phones. What would the expected frequency
be for each category? What is the df?

125 (500/4 =125); df = 3


The null hypothesis for a goodness of fit test states what?

All frequencies of a particular variable are equal.


The null hypothesis for a test for independence states what?

The two variables are independent of one another.


Which of the following is NOT one of the assumptions made in a chi-square test?

The expected frequency for each category must be at least 5.

2 multiple choice options


In a goodness of fit test, if the null hypothesis is not rejected, then differences between the
observed and expected frequencies are most likely due to ________.

Sampling Error

Información del documento

Subido en
17 de abril de 2026
Número de páginas
8
Escrito en
2025/2026
Tipo
Examen
Contiene
Preguntas y respuestas
$11.99

¿Documento equivocado? Cámbialo gratis Dentro de los 14 días posteriores a la compra y antes de descargarlo, puedes elegir otro documento. Puedes gastar el importe de nuevo.
Escrito por estudiantes que aprobaron
Inmediatamente disponible después del pago
Leer en línea o como PDF

Seller avatar
Los indicadores de reputación están sujetos a la cantidad de artículos vendidos por una tarifa y las reseñas que ha recibido por esos documentos. Hay tres niveles: Bronce, Plata y Oro. Cuanto mayor reputación, más podrás confiar en la calidad del trabajo del vendedor.
EliteStudyExams
4.0
(700)
Vendido
3588
Seguidores
2869
Artículos
9199
Última venta
17 horas hace


Por qué los estudiantes eligen Stuvia

Creado por compañeros estudiantes, verificado por reseñas

Calidad en la que puedes confiar: escrito por estudiantes que aprobaron y evaluado por otros que han usado estos resúmenes.

¿No estás satisfecho? Elige otro documento

¡No te preocupes! Puedes elegir directamente otro documento que se ajuste mejor a lo que buscas.

Paga como quieras, empieza a estudiar al instante

Sin suscripción, sin compromisos. Paga como estés acostumbrado con tarjeta de crédito y descarga tu documento PDF inmediatamente.

Student with book image

“Comprado, descargado y aprobado. Así de fácil puede ser.”

Alisha Student

Preguntas frecuentes