3.2 Challenges in the human environment
3.2.1 Section A: Urban issues and challenges
Urban growth refers to the increased numbers living in cities.
"Urbanisation" means the increasing percentage (not numbers) of people living in urban areas in a country rather than rural
areas.
(note – you can have urban growth without urbanisation just because the whole population grows in both rural and urban areas)
1 – What is urban and rural
Urban – more developed cities and towns with high population
Rural – places with low population density – villages and hamlets
2 - What percentage of people do you think live in urban areas in the UK?
80%
3 – What percentage of people live in urban areas in the world?
55%
4 - How have urban numbers and urbanisation been changing around the world?
The proportion of people living in towns and cities caries in different parts of the world.
• In most of the world’s richer countries over 60% of the population live in cities
• In south and South East Asia around half the population live in towns and cities
• All but six countries in Africa have urban populations of more than 20%. The average is almost 40%.
In different regions of the world the urban population is growing at different rates.
The distribution of the world’s urban population
- The largest growth in urban population by 2050 will take place in India, China and Nigeria. (NEE countries)
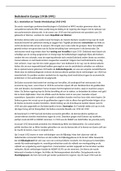
,Trends in urban populations
Examine the graph below about trends in urban growth. Note – the line with triangles on is for poorer countries and
the ones with circles are for richer countries. The black symbols are the rural population and the white ones the
urban population
1 – Compare the changes in urban population in more developed (richer) and less developed (poorer) regions.
2 – Estimate the total number of people living in less developed regions in the year 2020 (the white triangle plus the
black triangle values).
3 – Estimate the percentage living in urban areas compared to rural areas in just the less developed region in the
year 2020. (divide the white triangle value by the white plus black triangle total and then multiply by 100).
4 – Now estimate the % living in urban areas in just the less developed regions in 1950.
5 – Finally estimate the % living in urban areas in the more developed regions (circles) in 2020.
Note the syllabus uses the terms:
LIC for low income country (less developed regions – very poor places): Bangladesh, Uganda
HIC for high income country (more developed regions – rich countries): UK, USA, Japan
NEE for Newly Emerging Economies (countries that are starting to change from poor to richer ones – rapidly growing
economies): Nigeria, Saudi Arabia, India, China
, 1. Using the map describe how the percentage of people living in urban areas varies around the world
(include data and names of countries/ areas in your answer)
There were relatively more rural population in Asian countries, however most of them have been growing.
Most cities and megacities are located near the coast such as Tokyo, London, Jakarta.
2. Using the graphs below the map compare the changes in urban population in different regions since the
1950s until 2014. Where has the rate of urban growth been the fastest and slowest?
The fastest rate of growth will be Africa, Latin America and Asia. The slowest would be Oceania.
Reasons for urbanisation – push and pull factors
Urban growth has been due to two main factors:
Natural (population) increase – where there are more births than deaths.
This is due to high birth rates of many young people living in cities, particularly in low income countries, along with
better health care resulting in lower infant mortality (death of children)
Migration – lots of people moving to cities from rural areas – particularly in low income countries recently.
In richer countries there tends to be a higher percentage living in urban areas, as people moved from the
countryside to work in cities over the last 200 years, with most people working in office type jobs.
, In poorer countries many still live and work in rural areas as farmers,
but as they start to develop new jobs in factories and offices, the
urban areas have begun to grow larger. So recently the fastest urban
growth has been seen in poorer and rapidly developing countries
(NEEs).
Reasons for migration to cities can be grouped into two categories
Push factors – things that make you want to leave a rural area
Pull factors – things that make you want to move to a specific place
1 - Look at the list of factors below that may influence migration to cities in poorer countries and decide if they are
push or pull factors: (add any other ideas at the end)
Push factors:
• Lack of employment opportunities as machines replace farm work
• Farming is hard work with long hours and little pay
• Extreme physical conditions, e.g. aridity, mountainous terrain, cold, heat and dense vegetation.
• Natural hazards like droughts can destroy crops
• Limited food production due to overgrazing or the misuse of land, resulting in soil erosion or exhaustion.
• Starvation, resulting from either too little output for the people in the area or crop failure
• Pressure on the land, e.g. division of land among sons – each has too little to live on.
• Many families do not own land
• People forced to move as wealthy farming and mining companies buy their land.
• Lack of government investment in rural areas
• Lack of services like piped water or electricity
• Poor water quality leading to diseases
Pull factors:
• Better schools and universities for education
• Chance to gain new training and skills
• Wider range of job opportunities
• Better paid jobs. (factory workers receive about three times the wages of farm workers)
• More comfortable houses and a higher quality of life
• Lots more people to meet and make friends with
• More tolerance towards people’s views and religions
• Excitement or city life and entertainment
• More reliable sources of food
• Access to the best medical facilities in the country
2 – Consider which are the most and least important factors in influencing migration into cities – explain your
choices.
3 – Consider why people may not move to cites despite these various push and pull factors
They have emotional links to their land and homes. Education.
4 – In what ways would these push and pull factors be different in Higher Income Countries?
5 – What do you think will happen in the future? Will more or less people decide to live in cities around the world?
3.2.1 Section A: Urban issues and challenges
Urban growth refers to the increased numbers living in cities.
"Urbanisation" means the increasing percentage (not numbers) of people living in urban areas in a country rather than rural
areas.
(note – you can have urban growth without urbanisation just because the whole population grows in both rural and urban areas)
1 – What is urban and rural
Urban – more developed cities and towns with high population
Rural – places with low population density – villages and hamlets
2 - What percentage of people do you think live in urban areas in the UK?
80%
3 – What percentage of people live in urban areas in the world?
55%
4 - How have urban numbers and urbanisation been changing around the world?
The proportion of people living in towns and cities caries in different parts of the world.
• In most of the world’s richer countries over 60% of the population live in cities
• In south and South East Asia around half the population live in towns and cities
• All but six countries in Africa have urban populations of more than 20%. The average is almost 40%.
In different regions of the world the urban population is growing at different rates.
The distribution of the world’s urban population
- The largest growth in urban population by 2050 will take place in India, China and Nigeria. (NEE countries)
,Trends in urban populations
Examine the graph below about trends in urban growth. Note – the line with triangles on is for poorer countries and
the ones with circles are for richer countries. The black symbols are the rural population and the white ones the
urban population
1 – Compare the changes in urban population in more developed (richer) and less developed (poorer) regions.
2 – Estimate the total number of people living in less developed regions in the year 2020 (the white triangle plus the
black triangle values).
3 – Estimate the percentage living in urban areas compared to rural areas in just the less developed region in the
year 2020. (divide the white triangle value by the white plus black triangle total and then multiply by 100).
4 – Now estimate the % living in urban areas in just the less developed regions in 1950.
5 – Finally estimate the % living in urban areas in the more developed regions (circles) in 2020.
Note the syllabus uses the terms:
LIC for low income country (less developed regions – very poor places): Bangladesh, Uganda
HIC for high income country (more developed regions – rich countries): UK, USA, Japan
NEE for Newly Emerging Economies (countries that are starting to change from poor to richer ones – rapidly growing
economies): Nigeria, Saudi Arabia, India, China
, 1. Using the map describe how the percentage of people living in urban areas varies around the world
(include data and names of countries/ areas in your answer)
There were relatively more rural population in Asian countries, however most of them have been growing.
Most cities and megacities are located near the coast such as Tokyo, London, Jakarta.
2. Using the graphs below the map compare the changes in urban population in different regions since the
1950s until 2014. Where has the rate of urban growth been the fastest and slowest?
The fastest rate of growth will be Africa, Latin America and Asia. The slowest would be Oceania.
Reasons for urbanisation – push and pull factors
Urban growth has been due to two main factors:
Natural (population) increase – where there are more births than deaths.
This is due to high birth rates of many young people living in cities, particularly in low income countries, along with
better health care resulting in lower infant mortality (death of children)
Migration – lots of people moving to cities from rural areas – particularly in low income countries recently.
In richer countries there tends to be a higher percentage living in urban areas, as people moved from the
countryside to work in cities over the last 200 years, with most people working in office type jobs.
, In poorer countries many still live and work in rural areas as farmers,
but as they start to develop new jobs in factories and offices, the
urban areas have begun to grow larger. So recently the fastest urban
growth has been seen in poorer and rapidly developing countries
(NEEs).
Reasons for migration to cities can be grouped into two categories
Push factors – things that make you want to leave a rural area
Pull factors – things that make you want to move to a specific place
1 - Look at the list of factors below that may influence migration to cities in poorer countries and decide if they are
push or pull factors: (add any other ideas at the end)
Push factors:
• Lack of employment opportunities as machines replace farm work
• Farming is hard work with long hours and little pay
• Extreme physical conditions, e.g. aridity, mountainous terrain, cold, heat and dense vegetation.
• Natural hazards like droughts can destroy crops
• Limited food production due to overgrazing or the misuse of land, resulting in soil erosion or exhaustion.
• Starvation, resulting from either too little output for the people in the area or crop failure
• Pressure on the land, e.g. division of land among sons – each has too little to live on.
• Many families do not own land
• People forced to move as wealthy farming and mining companies buy their land.
• Lack of government investment in rural areas
• Lack of services like piped water or electricity
• Poor water quality leading to diseases
Pull factors:
• Better schools and universities for education
• Chance to gain new training and skills
• Wider range of job opportunities
• Better paid jobs. (factory workers receive about three times the wages of farm workers)
• More comfortable houses and a higher quality of life
• Lots more people to meet and make friends with
• More tolerance towards people’s views and religions
• Excitement or city life and entertainment
• More reliable sources of food
• Access to the best medical facilities in the country
2 – Consider which are the most and least important factors in influencing migration into cities – explain your
choices.
3 – Consider why people may not move to cites despite these various push and pull factors
They have emotional links to their land and homes. Education.
4 – In what ways would these push and pull factors be different in Higher Income Countries?
5 – What do you think will happen in the future? Will more or less people decide to live in cities around the world?