A1:
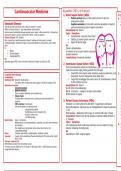
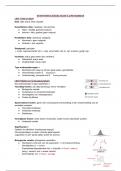
Overall
framework
Blue
are
weeknumbers
4
3
2 5
1
6
Market
balance
sheet
gives
the
company
market
value
(PV
of
all
the
Free
cash
flow
engine,
FCF).
So
take
the
value
of
the
FCF,
deduct
it
with
Debt,
than
what’s
left
is
Equity.
Free
cash
flow
=
what
is
left
for
the
investor.
FCF
profile
consist
of
3
things:
-‐ Volatility
(standard
deviation,
what
differs
it
from
the
mean
=
risk)
-‐ Level
-‐ Growth
Understand
the
business,
where
does
the
money
come
from,
how
does
the
company
generates
its
cash?
What
is
the
strategy?
What
is
the
position?
And
so
on.
Translates
itself
in
Asset/Business
risk
+
Financing
risk
Solvency
=
D/E
=
To
what
extend
is
the
company
financed
with
debt
(more
long
term)
Liquidity
=
NWC
=
Net
working
capital
(more
short
term)
Cost
of
capital
(company
perspective)
=
Required
rate
of
return
(investor
perspective)
Corporate
finance
at
different
levels:
-‐ Long
term
finance
-‐
Long
term
investments
-‐
Capital
structure
-‐
Equity
versus
debt
-‐ Short
term
finance
-‐
Working
capital
management
(total
funding
need
for
WC
assets)
-‐
Liquidity
management
(liquidity
assets,
maturity
funding)
-‐ Cash
management
(not
in
this
course)
A2:
Market
balance
sheet
vs
Book
balance
sheet
Book
balance
can
change
by
changes
in
reporting,
but
the
market
balance
sheet
doesn’t
change.
The
free
cash
flow
doesn’t
change!
So
the
book
value
is
irrelevant
for
the
valuation
of
the
company.
Subordinated
debt
=
first
in
line
to
get
their
money
back
, From
book
balance
to
market
balance:
When
a
distressed
company
is
financed
with
debt,
this
debt
can
be
bought
for
a
certain
price.
For
example
when
there
is
a
finance
debt
of
600
mio,
but
the
market
price
is
only
38%,
the
value
of
that
debt
is
only
0,38*600=228
mio
(=
implied
enterprise
value).
So
the
value
for
the
investors
only
consist
of
this
market
value:
228
instead
of
600.
Equity
value
is
0,
because
of
all
the
claims
they
only
want
to
pay
228,
so
the
residual
is
(less
than)
0.
The
market
value
of
the
company
is
also
only
228
mio,
because
assets
are
equal
to
liabilities:
228
228
=
Vc
=
FCF
t
(1+
WACC)^t
FCF
(NOPAT
=
rude
proxy
of
FCF)
=
Operational
CF
–
Investment
CF
–
Tax
CF
Operational
CF
=
EBITDA
Investment
CF
=
Depreciation
(maintenance
CF)
When
an
infinite
stream
of
NOPAT,
PV
=
NOPAT
/
WACC
When
NOPAT
is
growing
by
inflation,
PV
=
NOPAT
/
real
WACC
So
when
you
know
the
Vc
(228
in
this
case)
and
you
know
NOPAT
((EBITDA
–
Depreciation)*(1-‐T))
you
can
calculate
implied
WACC.
B1:
Business
Analysis
tools
Understanding
the
business,
how
to
come
up
with
the
cash
flows
and
how
to
predict
them?
If
you
are
not
familiar
with
the
business,
look
at
financial
ratio’s:
1. Profitability
ratio’s
2. Efficiency
ratio’s
3. Leverage
ratio’s
4. Liquidity
ratio’s
5. Coverage
ratio’s
6. Growth
%
7. Ratio’s
with
market
value
information
Then
look
at
what’s
driving
the
profits:
business
performance
-‐ Find
key
drivers
of
sales,
cost
structure
and
profitability
-‐ Find
trends
for
extrapolation
(time
series)
-‐ Find
competitive
advantage
(relative
to
peers)
-‐ Last
2
give
an
indication
of
how
the
company
is
doing,
outperformer,
behind?
Financial
ratios
only
have
a
meaning
when
you
benchmark
them
with
sector
peers
and
compare
them
with
historical
time
series.
-‐ Separate
out
structural
and
incidental
development
-‐ Be
aware
of
accounting
differences/changes
-‐ Detect
inconsistencies
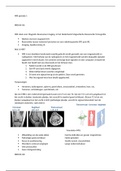
Different
numbers:
3
types
of
profitability
analysis:
1. Dupont
formula:
splits
ROA
between
margins
and
asset
turnover.
So
you
can
see
if
a
company
is
a
margin
company
or
volume
company:
ATO
High
ATO
company
(for
example
a
retail
shop)
High
sale
margin
Margin
Dupont
=
Net
profit
margin
x
Asset
turnover
where
NPM
=
net
income
/
turnover
and
AT
=
turnover
/
assets
2. Added
value:
Gross
margin
ratio
=
(net
sales
–
COGS)
/
net
sales
Tells
you
what
you
add,
also
bruto
marge!
Tells
you
how
vulnerable
you
are
to
your
supplier
market
3. Breakeven
calculations:
Fixed
versus
variable
costs
-‐
breakeven
analysis,
at
what
volume
are
the
costs
the
same
as
the
revenues?
After
that
certain
volume
you
start
making
profits
-‐
cash
breakeven
analysis
, B2:
Cash
conversion
cycle
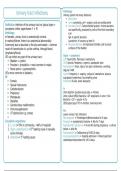
Working
capital:
Cash
Acc
payable
Current
Acc
receiv.
Debt
Liabilities
Inv
Current
Assets
Red
=
included
in
cash
conversion
cycle
Cash
conversion
cycle
=
DSO
+
DIO
–
DPO,
it
provides
insight
in
the
financing
need
for
working
capital.
Cash
cycle
is
different
than
physical
cycle
DIO DSO
DPO
Convert
these
cycles
to
balance
sheet
items:
Inventory
=
Inventory
cycle
x
COGS
365
Accounts
receivable
=
Acc
rec.
cycle
x
sales
365
Working
capital
funding
need
=
CCC
x
COGS
365
sales
So
for
example
when
you
have
a
CCC
of
2
months:
2/12
x
Annual
sales
When
you
minimize
the
DIO
and
DSO
and
maximize
the
DPO,
you
can
minimize
the
CCC
and
free
a
lot
of
capital
to
do
other
investments.
Position
in
the
value
chain
determines
CCC.
If
you
have
powerful
clients,
you
might
have
a
large
DSO
(client
will
pay
late),
but
if
you
are
dominant
yourself
you
can
press
your
clients
to
have
a
larger
DPO
(pay
later
yourself).
AHOLD
example:
DSO
=
0,
because
clients
pay
directly
in
the
stores.
DIO
=
also
0
and
DPO
can
be
very
long,
for
example
30
days.
So
then
the
CCC
is
-‐30
Supply
chain
finance
(=financing
working
capital)
Basically
the
bank
is
lending
money
to
Unilever
because
they
have
a
high
credit
rating.
So
Unilever’s
accounts
payable
goes
up
and
the
suppliers
accounts
receivable
goes
down.
Eveybody
benefits:
bank
has
business,
unilever
has
higher
DPO
and
supplier
gets
their
money
earlier.
Overall
framework
Blue
are
weeknumbers
4
3
2 5
1
6
Market
balance
sheet
gives
the
company
market
value
(PV
of
all
the
Free
cash
flow
engine,
FCF).
So
take
the
value
of
the
FCF,
deduct
it
with
Debt,
than
what’s
left
is
Equity.
Free
cash
flow
=
what
is
left
for
the
investor.
FCF
profile
consist
of
3
things:
-‐ Volatility
(standard
deviation,
what
differs
it
from
the
mean
=
risk)
-‐ Level
-‐ Growth
Understand
the
business,
where
does
the
money
come
from,
how
does
the
company
generates
its
cash?
What
is
the
strategy?
What
is
the
position?
And
so
on.
Translates
itself
in
Asset/Business
risk
+
Financing
risk
Solvency
=
D/E
=
To
what
extend
is
the
company
financed
with
debt
(more
long
term)
Liquidity
=
NWC
=
Net
working
capital
(more
short
term)
Cost
of
capital
(company
perspective)
=
Required
rate
of
return
(investor
perspective)
Corporate
finance
at
different
levels:
-‐ Long
term
finance
-‐
Long
term
investments
-‐
Capital
structure
-‐
Equity
versus
debt
-‐ Short
term
finance
-‐
Working
capital
management
(total
funding
need
for
WC
assets)
-‐
Liquidity
management
(liquidity
assets,
maturity
funding)
-‐ Cash
management
(not
in
this
course)
A2:
Market
balance
sheet
vs
Book
balance
sheet
Book
balance
can
change
by
changes
in
reporting,
but
the
market
balance
sheet
doesn’t
change.
The
free
cash
flow
doesn’t
change!
So
the
book
value
is
irrelevant
for
the
valuation
of
the
company.
Subordinated
debt
=
first
in
line
to
get
their
money
back
, From
book
balance
to
market
balance:
When
a
distressed
company
is
financed
with
debt,
this
debt
can
be
bought
for
a
certain
price.
For
example
when
there
is
a
finance
debt
of
600
mio,
but
the
market
price
is
only
38%,
the
value
of
that
debt
is
only
0,38*600=228
mio
(=
implied
enterprise
value).
So
the
value
for
the
investors
only
consist
of
this
market
value:
228
instead
of
600.
Equity
value
is
0,
because
of
all
the
claims
they
only
want
to
pay
228,
so
the
residual
is
(less
than)
0.
The
market
value
of
the
company
is
also
only
228
mio,
because
assets
are
equal
to
liabilities:
228
228
=
Vc
=
FCF
t
(1+
WACC)^t
FCF
(NOPAT
=
rude
proxy
of
FCF)
=
Operational
CF
–
Investment
CF
–
Tax
CF
Operational
CF
=
EBITDA
Investment
CF
=
Depreciation
(maintenance
CF)
When
an
infinite
stream
of
NOPAT,
PV
=
NOPAT
/
WACC
When
NOPAT
is
growing
by
inflation,
PV
=
NOPAT
/
real
WACC
So
when
you
know
the
Vc
(228
in
this
case)
and
you
know
NOPAT
((EBITDA
–
Depreciation)*(1-‐T))
you
can
calculate
implied
WACC.
B1:
Business
Analysis
tools
Understanding
the
business,
how
to
come
up
with
the
cash
flows
and
how
to
predict
them?
If
you
are
not
familiar
with
the
business,
look
at
financial
ratio’s:
1. Profitability
ratio’s
2. Efficiency
ratio’s
3. Leverage
ratio’s
4. Liquidity
ratio’s
5. Coverage
ratio’s
6. Growth
%
7. Ratio’s
with
market
value
information
Then
look
at
what’s
driving
the
profits:
business
performance
-‐ Find
key
drivers
of
sales,
cost
structure
and
profitability
-‐ Find
trends
for
extrapolation
(time
series)
-‐ Find
competitive
advantage
(relative
to
peers)
-‐ Last
2
give
an
indication
of
how
the
company
is
doing,
outperformer,
behind?
Financial
ratios
only
have
a
meaning
when
you
benchmark
them
with
sector
peers
and
compare
them
with
historical
time
series.
-‐ Separate
out
structural
and
incidental
development
-‐ Be
aware
of
accounting
differences/changes
-‐ Detect
inconsistencies
Different
numbers:
3
types
of
profitability
analysis:
1. Dupont
formula:
splits
ROA
between
margins
and
asset
turnover.
So
you
can
see
if
a
company
is
a
margin
company
or
volume
company:
ATO
High
ATO
company
(for
example
a
retail
shop)
High
sale
margin
Margin
Dupont
=
Net
profit
margin
x
Asset
turnover
where
NPM
=
net
income
/
turnover
and
AT
=
turnover
/
assets
2. Added
value:
Gross
margin
ratio
=
(net
sales
–
COGS)
/
net
sales
Tells
you
what
you
add,
also
bruto
marge!
Tells
you
how
vulnerable
you
are
to
your
supplier
market
3. Breakeven
calculations:
Fixed
versus
variable
costs
-‐
breakeven
analysis,
at
what
volume
are
the
costs
the
same
as
the
revenues?
After
that
certain
volume
you
start
making
profits
-‐
cash
breakeven
analysis
, B2:
Cash
conversion
cycle
Working
capital:
Cash
Acc
payable
Current
Acc
receiv.
Debt
Liabilities
Inv
Current
Assets
Red
=
included
in
cash
conversion
cycle
Cash
conversion
cycle
=
DSO
+
DIO
–
DPO,
it
provides
insight
in
the
financing
need
for
working
capital.
Cash
cycle
is
different
than
physical
cycle
DIO DSO
DPO
Convert
these
cycles
to
balance
sheet
items:
Inventory
=
Inventory
cycle
x
COGS
365
Accounts
receivable
=
Acc
rec.
cycle
x
sales
365
Working
capital
funding
need
=
CCC
x
COGS
365
sales
So
for
example
when
you
have
a
CCC
of
2
months:
2/12
x
Annual
sales
When
you
minimize
the
DIO
and
DSO
and
maximize
the
DPO,
you
can
minimize
the
CCC
and
free
a
lot
of
capital
to
do
other
investments.
Position
in
the
value
chain
determines
CCC.
If
you
have
powerful
clients,
you
might
have
a
large
DSO
(client
will
pay
late),
but
if
you
are
dominant
yourself
you
can
press
your
clients
to
have
a
larger
DPO
(pay
later
yourself).
AHOLD
example:
DSO
=
0,
because
clients
pay
directly
in
the
stores.
DIO
=
also
0
and
DPO
can
be
very
long,
for
example
30
days.
So
then
the
CCC
is
-‐30
Supply
chain
finance
(=financing
working
capital)
Basically
the
bank
is
lending
money
to
Unilever
because
they
have
a
high
credit
rating.
So
Unilever’s
accounts
payable
goes
up
and
the
suppliers
accounts
receivable
goes
down.
Eveybody
benefits:
bank
has
business,
unilever
has
higher
DPO
and
supplier
gets
their
money
earlier.