Elementary Stats Exam Save Groups
Questions
Terms in this set (98)
1. To examine the relationship A
between two variables, the variables
must be measured from the same
_______.
A) cases B) labels C) units D) values
2. A particularly common question in C
the study of wildlife behavior involves
observing contests between "residents"
of a particular area and "intruders." In
each contest, the residents either win
or lose the encounter (assuming there
are no ties). Observers might record
several variables, some of which are
listed below. Which of these variables
is
categorical?
A) The duration of the contest (in
seconds)
B) The number of animals involved in
the contest
C) Whether the residents win or lose
D) The total number of contests won
by the residents
3. Variables that take numeric values A
for which arithmetic operations make
sense are called _______.
A) quantitative B) categorical C)
distributions D) cases
,We have a data set where the cases are A
college students. One of the variables
in the data set is "age of the student."
What type of variable is age of the
student?
A) Quantitative
B) Categorical
C) Quantitative and categorical
D) None of the above
5. Suppose you own a pizza delivery B
company and you are trying to
determine the best campus on which
to sell
pizza. What would be the best
measurement to make the
comparison?
A) Average number of pizzas
purchased
B) Count of pizzas purchased
C) Rate of pizzas purchased
D) None of the above
6. Quantitative variables are best A
displayed using _______.
A) stemplots
B) pie charts
C) bar graphs
D) pie charts or bar graphs
7. Large data sets with quantitative B
variables are best displayed using
________.
A) stemplots
B) histograms
C) stemplots and histograms
D) none of the above
,8. Below is a data set with information D
on students in a basic statistics class
at a local university. What is a key
characteristic of the data set?
Student ID GPA Hometown Major
23455 3.1 Chicago Math
23672 3.2 DC Statistics
4572 4 Atlanta Applied Math
89675 2.1 Kansas City Undeclared
65546 3.2 New York City Biology
7789 2.8 Raleigh Biology
90956 2.2 Santa Monica Statistics
56378 3 Richmond History
36455 3.8 Dallas Physics
46456 11.1 Austin Anthropology
A) There are 10 students in the data
set.
B) The data describe students in a
class.
C) There are three variables in the data
set.
D) All of the above
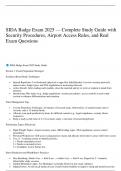
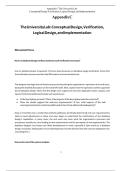
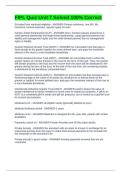
A distributor of electronics is doing a C
customer satisfaction survey for a
manufacturer of tablet computers. A
sample of 68 clients is asked to rate a
particular tablet on appearance,
functionality, ease of use, and price on
a
scale of 1 to 10, where 1 corresponds
to the worst rating and 10 to the best
possible rating. A bar graph of the
ease
of use ratings classified by gender is
given below.
What percentage of the sampled
female clients rated the tablet as not
so easy to use (a rating of 4 or lower)?
A) 28% B) 29% C) 38% D) 62%
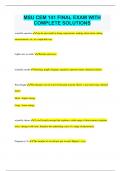
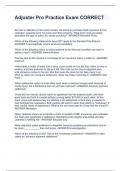
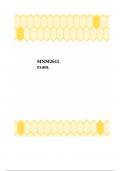
, 10. In a statistics class with 136 B
students, the professor records how
much money each student has in their
possession during the first class of the
semester. The histogram shown below
represents the data he collected.
What is approximately the number of
students with $30 or more in their
possession?
A) Less than 5 B) About 10 C) About 30
D) More than 100
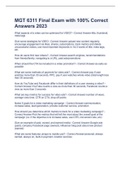
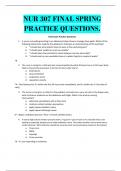
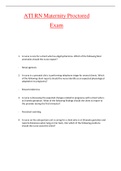
11. During the early part of the 1994 C
baseball season, many sports fans and
baseball players noticed that the
number
of home runs being hit seemed to be
unusually large. Below are separate
stemplots for the number of home
runs
by American League and National
League teams based on the team-by-
team statistics on home runs hit
through
Friday, June 3, 1994 (from the
Columbus Dispatch, Sunday, June 5,
1994).
Legend: 2|9 represents 29.
What is the mean for the number of
home runs for the National League
teams?
A) 45 B) 50 C) 50.1 D) 57.5
Questions
Terms in this set (98)
1. To examine the relationship A
between two variables, the variables
must be measured from the same
_______.
A) cases B) labels C) units D) values
2. A particularly common question in C
the study of wildlife behavior involves
observing contests between "residents"
of a particular area and "intruders." In
each contest, the residents either win
or lose the encounter (assuming there
are no ties). Observers might record
several variables, some of which are
listed below. Which of these variables
is
categorical?
A) The duration of the contest (in
seconds)
B) The number of animals involved in
the contest
C) Whether the residents win or lose
D) The total number of contests won
by the residents
3. Variables that take numeric values A
for which arithmetic operations make
sense are called _______.
A) quantitative B) categorical C)
distributions D) cases
,We have a data set where the cases are A
college students. One of the variables
in the data set is "age of the student."
What type of variable is age of the
student?
A) Quantitative
B) Categorical
C) Quantitative and categorical
D) None of the above
5. Suppose you own a pizza delivery B
company and you are trying to
determine the best campus on which
to sell
pizza. What would be the best
measurement to make the
comparison?
A) Average number of pizzas
purchased
B) Count of pizzas purchased
C) Rate of pizzas purchased
D) None of the above
6. Quantitative variables are best A
displayed using _______.
A) stemplots
B) pie charts
C) bar graphs
D) pie charts or bar graphs
7. Large data sets with quantitative B
variables are best displayed using
________.
A) stemplots
B) histograms
C) stemplots and histograms
D) none of the above
,8. Below is a data set with information D
on students in a basic statistics class
at a local university. What is a key
characteristic of the data set?
Student ID GPA Hometown Major
23455 3.1 Chicago Math
23672 3.2 DC Statistics
4572 4 Atlanta Applied Math
89675 2.1 Kansas City Undeclared
65546 3.2 New York City Biology
7789 2.8 Raleigh Biology
90956 2.2 Santa Monica Statistics
56378 3 Richmond History
36455 3.8 Dallas Physics
46456 11.1 Austin Anthropology
A) There are 10 students in the data
set.
B) The data describe students in a
class.
C) There are three variables in the data
set.
D) All of the above
A distributor of electronics is doing a C
customer satisfaction survey for a
manufacturer of tablet computers. A
sample of 68 clients is asked to rate a
particular tablet on appearance,
functionality, ease of use, and price on
a
scale of 1 to 10, where 1 corresponds
to the worst rating and 10 to the best
possible rating. A bar graph of the
ease
of use ratings classified by gender is
given below.
What percentage of the sampled
female clients rated the tablet as not
so easy to use (a rating of 4 or lower)?
A) 28% B) 29% C) 38% D) 62%
, 10. In a statistics class with 136 B
students, the professor records how
much money each student has in their
possession during the first class of the
semester. The histogram shown below
represents the data he collected.
What is approximately the number of
students with $30 or more in their
possession?
A) Less than 5 B) About 10 C) About 30
D) More than 100
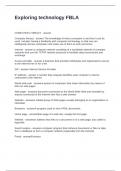
11. During the early part of the 1994 C
baseball season, many sports fans and
baseball players noticed that the
number
of home runs being hit seemed to be
unusually large. Below are separate
stemplots for the number of home
runs
by American League and National
League teams based on the team-by-
team statistics on home runs hit
through
Friday, June 3, 1994 (from the
Columbus Dispatch, Sunday, June 5,
1994).
Legend: 2|9 represents 29.
What is the mean for the number of
home runs for the National League
teams?
A) 45 B) 50 C) 50.1 D) 57.5