Time Series
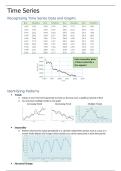
Recognising Time Series Data and Graphs
Each consecutive piece
of data is joined by a
line segment
Identifying Patterns
Trends
o Values in your Time Series generally increase or decrease over a significant period of time
o You may have multiple trends in one graph
Increasing Trend Decreasing Trend Multiple Trends
Seasonality
o Patterns that tend to repeat periodically in a calendar-related time period, such as a year or a
month. Peaks (highs) and Troughs (lows) should occur at the same point in each time period.
Structural Change
, o When an established pattern in a Time Series changes suddenly
Possible Outliers
o Individual data values that stand out from the general pattern or grouping of the data
Irregular Fluctuations
o All time series plots contain irregular fluctuations , unless they form a perfectly straight line.
o These are usually small, random changes in values throughout the graph.
o You can have irregular fluctuations within seasonal patterns or increasing/decreasing trends, it will
display as non-regular changes in between the peaks and troughs.
Time Series on the CAS
Spreadsheet → Title your columns → enter data,
make sure all values are numeric (e.g. Jan=1, Feb=2, etc.)
Ctrl + Doc → Add Data and Statistics → Construct Scatterplot
→ Hover cursor over scatterplot and press Ctrl + Menu
→ Connect Data Points
