HLT362V - Module 4 Exercise 33. Questions And Answers. 100% Correct
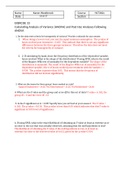
Name Karen Westbrook Course HLT362v Date 1/14/17 Section EXERCISE 33 Calculating Analysis of Variance (ANOVA) and Post Hoc Analyses Following ANOVA 1. Do the data meet criteria for homogeneity of variance? Provide a rationale for your answer. 1. When doing a Leven’s test, you test the equal variances assumption. The p value of hours worked post treatment = 0.455. This indicate that there is not any significant differences between the three groups variances. Therefore the data does not meet the criteria for homogeneity of variance. 2. 2. If calculating by hand, draw the frequency distribution of the dependent variable, hours worked. What is the shape of the distribution? If using SPSS, what is the result of the Shapiro-Wilk test of normality for the dependent variable? The shape of the distribution is unimodal. The result of the Shapiro-Wilk test of normality for the dependent variable, (the # of hours worked post treatment with the statistic ) = 0.934. The p value is greater than 0.05. This means that the frequency of distribution did not deviate significantly. 3. What are the means for three groups’ hours worked on a job? Support Employment = 14.60, TAU Observational = 15.20, TAU Randomized = 26.60 4. What are the F value and the group and error df for this set of data? F value= 6.162, the group df = 2 and the error df =12 5. Is the F significant at α = 0.05? Specify how you arrived at your answer. The F value = 6.162. The p value = 0.014. This p value is less than 0.05 which indicates that this F value is significant at 0.05 level of significance. 6. If using SPSS, what is the exact likelihood of obtaining an F value at least as extreme as or as close to the one that was actually observed, assuming that the null hypothesis is true? The likelihood of obtaining the F value, if the null hypothesis is true, is at least as extreme/as close to the observed value of 6.612, given by the p value 0.014.
Información del documento
- Subido en
- 6 de abril de 2021
- Número de páginas
- 8
- Escrito en
- 2020/2021
- Tipo
- Examen
- Contiene
- Preguntas y respuestas