COLLEGES KWANTITATIEVE ONDERZOEKSMETHODEN
College 1
Square root of Variance= Standard deviation
Relationship between two variables
Measures of relationship between two variables: covariance and correlation. This correlation can be:
Positive
o The more advertisements are seen, the more toffees are bought
Negative
o The more advertisements are seen, the less toffees are bought
Absent
Multiply the 2 deviation scores cross-product deviations add them up and divide by N-1= covariance
Covariance
Covariance: the extent to which deviation of one variable go hand in hand with deviation of another
variable; this can be positive of negative
But: with covariance you cannot tell whether the relationship is strong or not. If you use other units (x10
for example), the size of the covariance also changes. So, we cannot use the covariance as a measure of
the strength of the relationship between 2 variables!
Standardizing the covariance
To get a measure of the strength of the correlation between 2 variables, we convert the covariance
into standard units (standardization).
Standard units= standard deviations.
If we divide each deviation from the mean by the standard deviation, we get the distance to the
mean in standard deviations.
In other words, we express the distance to the average in standard deviation= units of standard
deviations.
In other words: we use z-scores!
If you first make z-scores of x and y and then calculate the covariance you get a standardized covariance.
Or: the Pearson product moment correlation coefficient.
Correlation
Correlation: the standardized covariance
, Pearson correlation coefficient
Varies between -1 and 1
o -1 means a perfect negative relation
o 1 means a perfect positive relation
o 0 does not mean any relation
The correlation coefficient does not have a (causal) direction!
r= .10 small effect (explains 1% of the variance)
r= .30 medium effect (explains 9% of the variance)
r= .50 major effect (explains 25% of the variance)
Pearson correlation coefficient and R2
The square of the correlation coefficient R2 is a measure of how much variance in one variable is explained
by the other.
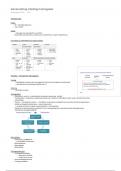
Null hypothesis significance testing
1. Formulate H0 and H1 hypothesis.
a. H0, there is no difference.
2. Determine the significance level alpha- should be a meaningful decision.
3. Decide on analysis.
4. Compute p-value – the observed statistic would be at least as big as it is if the null hypothesis were
true.
a. Regression analysis in SPSS automatically gives the p-value.
5. Compare p to alpha.
a. If p is less or equal than alpha reject H0.
b. If p is higher than alpha accept H0.
Misconceptions about statistical significance
1. A significant result means that the effect is important.
a. NO: very small effects can be significant if the sample size N is very large.
2. A non-significant result means that the null hypothesis is true.
a. NO: rejecting the H1 does not mean that H0 is true- it means that the effect is not big
enough to be found (given the sample size).
3. A significant result means the null hypothesis is false.
a. NO: it means that if H0 is correct, it is (highly) unlikely to find this value of T (or another test
statistic).
Report p-value precisely, it gives insight on how incompatible the outcomes are with the H0.
You can also look to the confidence interval, is the zero between the lower and upper bound. No? Reject
H0.
College 2
When can we consider a relationship X Y to be causal?
College 1
Square root of Variance= Standard deviation
Relationship between two variables
Measures of relationship between two variables: covariance and correlation. This correlation can be:
Positive
o The more advertisements are seen, the more toffees are bought
Negative
o The more advertisements are seen, the less toffees are bought
Absent
Multiply the 2 deviation scores cross-product deviations add them up and divide by N-1= covariance
Covariance
Covariance: the extent to which deviation of one variable go hand in hand with deviation of another
variable; this can be positive of negative
But: with covariance you cannot tell whether the relationship is strong or not. If you use other units (x10
for example), the size of the covariance also changes. So, we cannot use the covariance as a measure of
the strength of the relationship between 2 variables!
Standardizing the covariance
To get a measure of the strength of the correlation between 2 variables, we convert the covariance
into standard units (standardization).
Standard units= standard deviations.
If we divide each deviation from the mean by the standard deviation, we get the distance to the
mean in standard deviations.
In other words, we express the distance to the average in standard deviation= units of standard
deviations.
In other words: we use z-scores!
If you first make z-scores of x and y and then calculate the covariance you get a standardized covariance.
Or: the Pearson product moment correlation coefficient.
Correlation
Correlation: the standardized covariance
, Pearson correlation coefficient
Varies between -1 and 1
o -1 means a perfect negative relation
o 1 means a perfect positive relation
o 0 does not mean any relation
The correlation coefficient does not have a (causal) direction!
r= .10 small effect (explains 1% of the variance)
r= .30 medium effect (explains 9% of the variance)
r= .50 major effect (explains 25% of the variance)
Pearson correlation coefficient and R2
The square of the correlation coefficient R2 is a measure of how much variance in one variable is explained
by the other.
Null hypothesis significance testing
1. Formulate H0 and H1 hypothesis.
a. H0, there is no difference.
2. Determine the significance level alpha- should be a meaningful decision.
3. Decide on analysis.
4. Compute p-value – the observed statistic would be at least as big as it is if the null hypothesis were
true.
a. Regression analysis in SPSS automatically gives the p-value.
5. Compare p to alpha.
a. If p is less or equal than alpha reject H0.
b. If p is higher than alpha accept H0.
Misconceptions about statistical significance
1. A significant result means that the effect is important.
a. NO: very small effects can be significant if the sample size N is very large.
2. A non-significant result means that the null hypothesis is true.
a. NO: rejecting the H1 does not mean that H0 is true- it means that the effect is not big
enough to be found (given the sample size).
3. A significant result means the null hypothesis is false.
a. NO: it means that if H0 is correct, it is (highly) unlikely to find this value of T (or another test
statistic).
Report p-value precisely, it gives insight on how incompatible the outcomes are with the H0.
You can also look to the confidence interval, is the zero between the lower and upper bound. No? Reject
H0.
College 2
When can we consider a relationship X Y to be causal?