1|Page
STAT 200 Exam 3 2026
At a tennis tournament a statistician keeps track of every serve. The
statistician reported that the mean serve speed of a particular player
was 104 miles per hour (mph) and the standard deviation of the serve
speeds was 8 mph. Assume that the statistician also gave us the
information that the distribution of the serve speeds was bell shaped.
What percentage of the player's serves are expected to be between 104
and 112 mph? - ANSWER -34
The five number summary for a set of data was as follows: 2, 10, 400,
490, 548. Which of the following intervals would we expect to contain
the most observations in the data set? - ANSWER -400 to 548
The five number summary for a set of data was as follows: 2, 10, 400,
490, and 548. Which of the following best explains the shape of the
data? - ANSWER -Skewed left since the first half of the data falls in a
much wider range compared to the second half.
Based on the method described in lecture, which of the responses
below best describes the interpretation of the third quartile for the
following number of students enrolled in eight sections of a statistics
course: 65, 70, 72, 66, 67, 68, 69 and 71 - ANSWER -About 75% of the
sections had student enrollment of 70.5 or less
pg. 1
, 2|Page
How many pairs of shoes a person owns is what type of variable? -
ANSWER -discrete
The color of your eyes is what type of variable? - ANSWER -nominal
A PSU student group randomly selects 100 students attending
University Park and asks them whether or not they felt the campus was
safe to walk alone at night. The group reported that 86% of the
students surveyed said "Yes". Which of the following is the best
interpretation of this 86%? - ANSWER -86% of all University Park
students think the campus is safe to walk alone at night
A short quiz has five multiple choice questions, each question having
four answer choices with only one choice being correct. A student
guesses at each question. Which of the following answer sequences is
LEAST likely to occur? - ANSWER -Right, Wrong, Right, Wrong, Right
(the one with the most amount of "right" answers)
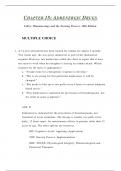
Which of the following is correct? The specificity of a test is found by: -
ANSWER -Probability of a negative test given the person does NOT have
the disease
[Table with Has Disease/No Disease and Negative Test/Positive Test]
From the table given, what is the probability that person either has the
disease or produces a negative test? - ANSWER -(170 + 5666 - 16)/
5970
pg. 2
STAT 200 Exam 3 2026
At a tennis tournament a statistician keeps track of every serve. The
statistician reported that the mean serve speed of a particular player
was 104 miles per hour (mph) and the standard deviation of the serve
speeds was 8 mph. Assume that the statistician also gave us the
information that the distribution of the serve speeds was bell shaped.
What percentage of the player's serves are expected to be between 104
and 112 mph? - ANSWER -34
The five number summary for a set of data was as follows: 2, 10, 400,
490, 548. Which of the following intervals would we expect to contain
the most observations in the data set? - ANSWER -400 to 548
The five number summary for a set of data was as follows: 2, 10, 400,
490, and 548. Which of the following best explains the shape of the
data? - ANSWER -Skewed left since the first half of the data falls in a
much wider range compared to the second half.
Based on the method described in lecture, which of the responses
below best describes the interpretation of the third quartile for the
following number of students enrolled in eight sections of a statistics
course: 65, 70, 72, 66, 67, 68, 69 and 71 - ANSWER -About 75% of the
sections had student enrollment of 70.5 or less
pg. 1
, 2|Page
How many pairs of shoes a person owns is what type of variable? -
ANSWER -discrete
The color of your eyes is what type of variable? - ANSWER -nominal
A PSU student group randomly selects 100 students attending
University Park and asks them whether or not they felt the campus was
safe to walk alone at night. The group reported that 86% of the
students surveyed said "Yes". Which of the following is the best
interpretation of this 86%? - ANSWER -86% of all University Park
students think the campus is safe to walk alone at night
A short quiz has five multiple choice questions, each question having
four answer choices with only one choice being correct. A student
guesses at each question. Which of the following answer sequences is
LEAST likely to occur? - ANSWER -Right, Wrong, Right, Wrong, Right
(the one with the most amount of "right" answers)
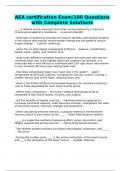
Which of the following is correct? The specificity of a test is found by: -
ANSWER -Probability of a negative test given the person does NOT have
the disease
[Table with Has Disease/No Disease and Negative Test/Positive Test]
From the table given, what is the probability that person either has the
disease or produces a negative test? - ANSWER -(170 + 5666 - 16)/
5970
pg. 2