Solution Manual For
Macroeconomics 11th Canadian Edition by McConnell, Brue, Barbiero
Chapter 1-16
ANSWERS TO END-OF-CHAPTER AND APPENDIX QUESTIONS
Chapter 1
1-3 (Key Question) Cite three examples of recent decisions that you made in which you, at least
implicitly, weighed marginal costs and marginal benefits.
Student answers will vary, but may include the decision to come to class, to skip breakfast to
get a few extra minutes of sleep, to attend college or university, or to make a purchase.
Marginal benefits of attending class may include the acquisition of knowledge, participation
in discussion, and better preparation for an upcoming examination. Marginal costs may
include lost opportunities for sleep, meals, or studying for other classes. In evaluating the
discussion of marginal benefits and marginal costs, be careful to watch for sunk costs offered
as a rationale for marginal decisions.
. ls for applying theory to practical scenarios. Furthermore, students often practice writing answers to past exams under timed conditions to enhance their ability to structure respo
1-5 (Key Question) Indicate whether each of the following statements applies to microeconomics
or macroeconomics:
a. The unemployment rate in Canada was 7.0 percent in January 2005.
b. A Canadian software firm discharged 15 workers last month and transferred the
work to India.
c. An unexpected freeze in central Florida reduced the citrus crop and caused the price
of oranges to rise.
d. Canadian output, adjusted for inflation, grew by 3.0 percent in 2004.
e. Last week the Scotia Bank lowered its interest rate on business loans by one-half of 1
percentage point.
f. The consumer price index rose by 2.2 percent in 2005.
Macroeconomics: (a), (d), and (f)
Microeconomics: (b), (c), and (e)
1-7 (Key Question) Suppose you won $15 on a Lotto Canada ticket at the local 7-Eleven and
decided to spend all the winnings on candy bars and bags of peanuts. The price of candy bars
is $.75 and the price of peanuts is $1.50.
a. Construct a table showing the alternative combinations of the two products that are
available.
b. Plot the data in your table as a budget line in a graph. What is the slope of the budget
line? What is the opportunity cost of one more candy bar? Of one more bag of
peanuts? Do these opportunity costs rise, fall, or remain constant as each additional
unit of the product is purchased.
c. How, in general, would you decide which of the available combinations of candy
bars and bags of peanuts to buy?
d. Suppose that you had won $30 on your ticket, not $15. Show the $30 budget line in
your diagram. Why would this budget line be preferable to the old one?
(a) Consumption alternatives
Copyright © 2007 McGraw-Hill 1 of 52
, Goods A B C D E F
Candy bars 0 4 8 12 16 20
Bags of peanuts 10 8 6 4 2 0
ls for applying theory to practical scenarios. Furthermore, students often practice writing answers to past exams under timed conditions to enhance their ability to structure respo
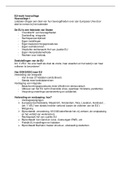
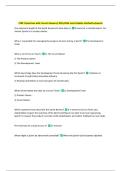
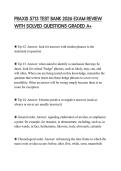
(b)
Bags of
Peanuts
.75
Slope .5
1.5
10
20 Candy Bars
The slope for the budget line above, with candy bars on the horizontal axis, is -0.5 (= -
Pcb/Pbp). Note that the figure could also be drawn with bags of peanuts on the horizontal
axis. The slope of that budget line would be -2.
The opportunity cost of one more candy bar is ½ of a bag of peanuts. The opportunity
cost of one more bag of peanuts is 2 candy bars. These opportunity costs are constant.
They can be found by comparing any two of the consumption alternatives for the two
goods.
(c) The decision of how much of each to buy would involve weighing the marginal benefits
and marginal costs of the various alternatives. If, for example, the marginal benefits of
moving from alternative C to alternative D are greater than the marginal costs, then this
consumer should move to D (and then compare again with E, and so forth, until MB=MC
is attained).
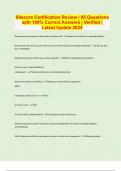
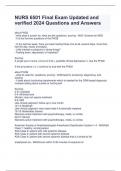
(d)
Copyright © 2007 McGraw-Hill 2 of 52
, B ags of
P eanuts
Incom e= $ 15
20
Inco me = $30
10
20 40 Candy Bars
The budget line at $30 would be preferable because it would allow greater consumption of
both goods.
ls for applying theory to practical scenarios. Furthermore, students often practice writing answers to past exams under timed conditions to enhance their ability to structure respo
1-10 (Key Question) Below is a production possibilities table for consumer goods (automobiles)
and capital goods (forklifts):
Type of Production Production Alternatives
A B C D E
Automobiles 0 2 4 6 8
Forklifts 30 27 21 12 0
a. Show these data graphically. Upon what specific assumptions is this production
possibilities curve based?
b. If the economy is at point C, what is the cost of one more automobile? Of one more
forklift? Explain how the production possibilities curve reflects the law of increasing
opportunity costs.
c. If the economy characterized by this production possibilities table and curve were
producing 3 automobiles and 20 fork lifts, what could you conclude about its use of
available resources?
d. What would production at a point outside the production possibilities curve indicate?
What must occur before the economy can attain such a level of production?
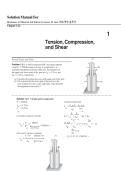
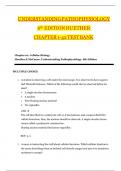
(a) See curve EDCBA. The assumptions are full employment, fixed supplies of resources,
fixed technology and two goods.
Copyright © 2007 McGraw-Hill 3 of 52
, Forklifts
ls for applying theory to practical scenarios. Furthermore, students often practice writing answers to past exams under timed conditions to enhance their ability to structure respo
(b) 4.5 forklifts; .33 automobiles, as determined from the table. Increasing opportunity costs
are reflected in the concave-from-the-origin shape of the curve. This means the economy
must give up larger and larger amounts of rockets to get constant added amounts of
automobiles—and vice versa.
(c) The economy is underutilizing its available resources. The assumption of full
employment has been violated.
(d) Production outside the curve cannot occur (consumption outside the curve could occur
through foreign trade). To produce beyond the current production possibilities curve this
economy must realize an increase in its available resources and/or technology.
.
1-11 (Key Question) Specify and explain the typical shapes of the marginal-benefit and marginal-
cost curves. How are these curves used to determine the optimal allocation of resources to a
particular product? If current output is such that marginal cost exceeds marginal benefit,
should more or fewer resources be allocated to this product? Explain.
The marginal benefit curve is downward sloping, MB falls as more of a product is consumed
because additional units of a good yield less satisfaction than previous units. The marginal
cost curve is upward sloping, MC increases as more of a product is produced since additional
units require the use of increasingly unsuitable resource. The optimal amount of a particular
product occurs where MB equals MC. If MC exceeds MB, fewer resources should be
allocated to this use. The resources are more valuable in some alternative use (as reflected in
the higher MC) than in this use (as reflected in the lower MB).
1-13 (Key Question) Suppose improvement occurs in the technology of producing forklifts but not
in the technology of producing automobiles. Draw the new production possibilities curve.
Now assume that a technological advance occurs in producing automobiles but not in
producing forklifts. Draw the new production possibilities curve. Now draw a production
possibilities curve that reflects technological improvement in the production of both products.
See the graph for question 1-10. PPC1 shows improved forklift technology. PPC2 shows
improved auto technology. PPC3 shows improved technology in producing both products.
1-14 (Key Question) On average, households in China save 40 percent of their annual income
each year, whereas households in the Canada save less than 5 percent. Production
possibilities are growing at roughly 9 percent annually in China and 3.5 percent in Canada.
Copyright © 2007 McGraw-Hill 4 of 52
Macroeconomics 11th Canadian Edition by McConnell, Brue, Barbiero
Chapter 1-16
ANSWERS TO END-OF-CHAPTER AND APPENDIX QUESTIONS
Chapter 1
1-3 (Key Question) Cite three examples of recent decisions that you made in which you, at least
implicitly, weighed marginal costs and marginal benefits.
Student answers will vary, but may include the decision to come to class, to skip breakfast to
get a few extra minutes of sleep, to attend college or university, or to make a purchase.
Marginal benefits of attending class may include the acquisition of knowledge, participation
in discussion, and better preparation for an upcoming examination. Marginal costs may
include lost opportunities for sleep, meals, or studying for other classes. In evaluating the
discussion of marginal benefits and marginal costs, be careful to watch for sunk costs offered
as a rationale for marginal decisions.
. ls for applying theory to practical scenarios. Furthermore, students often practice writing answers to past exams under timed conditions to enhance their ability to structure respo
1-5 (Key Question) Indicate whether each of the following statements applies to microeconomics
or macroeconomics:
a. The unemployment rate in Canada was 7.0 percent in January 2005.
b. A Canadian software firm discharged 15 workers last month and transferred the
work to India.
c. An unexpected freeze in central Florida reduced the citrus crop and caused the price
of oranges to rise.
d. Canadian output, adjusted for inflation, grew by 3.0 percent in 2004.
e. Last week the Scotia Bank lowered its interest rate on business loans by one-half of 1
percentage point.
f. The consumer price index rose by 2.2 percent in 2005.
Macroeconomics: (a), (d), and (f)
Microeconomics: (b), (c), and (e)
1-7 (Key Question) Suppose you won $15 on a Lotto Canada ticket at the local 7-Eleven and
decided to spend all the winnings on candy bars and bags of peanuts. The price of candy bars
is $.75 and the price of peanuts is $1.50.
a. Construct a table showing the alternative combinations of the two products that are
available.
b. Plot the data in your table as a budget line in a graph. What is the slope of the budget
line? What is the opportunity cost of one more candy bar? Of one more bag of
peanuts? Do these opportunity costs rise, fall, or remain constant as each additional
unit of the product is purchased.
c. How, in general, would you decide which of the available combinations of candy
bars and bags of peanuts to buy?
d. Suppose that you had won $30 on your ticket, not $15. Show the $30 budget line in
your diagram. Why would this budget line be preferable to the old one?
(a) Consumption alternatives
Copyright © 2007 McGraw-Hill 1 of 52
, Goods A B C D E F
Candy bars 0 4 8 12 16 20
Bags of peanuts 10 8 6 4 2 0
ls for applying theory to practical scenarios. Furthermore, students often practice writing answers to past exams under timed conditions to enhance their ability to structure respo
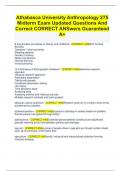
(b)
Bags of
Peanuts
.75
Slope .5
1.5
10
20 Candy Bars
The slope for the budget line above, with candy bars on the horizontal axis, is -0.5 (= -
Pcb/Pbp). Note that the figure could also be drawn with bags of peanuts on the horizontal
axis. The slope of that budget line would be -2.
The opportunity cost of one more candy bar is ½ of a bag of peanuts. The opportunity
cost of one more bag of peanuts is 2 candy bars. These opportunity costs are constant.
They can be found by comparing any two of the consumption alternatives for the two
goods.
(c) The decision of how much of each to buy would involve weighing the marginal benefits
and marginal costs of the various alternatives. If, for example, the marginal benefits of
moving from alternative C to alternative D are greater than the marginal costs, then this
consumer should move to D (and then compare again with E, and so forth, until MB=MC
is attained).
(d)
Copyright © 2007 McGraw-Hill 2 of 52
, B ags of
P eanuts
Incom e= $ 15
20
Inco me = $30
10
20 40 Candy Bars
The budget line at $30 would be preferable because it would allow greater consumption of
both goods.
ls for applying theory to practical scenarios. Furthermore, students often practice writing answers to past exams under timed conditions to enhance their ability to structure respo
1-10 (Key Question) Below is a production possibilities table for consumer goods (automobiles)
and capital goods (forklifts):
Type of Production Production Alternatives
A B C D E
Automobiles 0 2 4 6 8
Forklifts 30 27 21 12 0
a. Show these data graphically. Upon what specific assumptions is this production
possibilities curve based?
b. If the economy is at point C, what is the cost of one more automobile? Of one more
forklift? Explain how the production possibilities curve reflects the law of increasing
opportunity costs.
c. If the economy characterized by this production possibilities table and curve were
producing 3 automobiles and 20 fork lifts, what could you conclude about its use of
available resources?
d. What would production at a point outside the production possibilities curve indicate?
What must occur before the economy can attain such a level of production?
(a) See curve EDCBA. The assumptions are full employment, fixed supplies of resources,
fixed technology and two goods.
Copyright © 2007 McGraw-Hill 3 of 52
, Forklifts
ls for applying theory to practical scenarios. Furthermore, students often practice writing answers to past exams under timed conditions to enhance their ability to structure respo
(b) 4.5 forklifts; .33 automobiles, as determined from the table. Increasing opportunity costs
are reflected in the concave-from-the-origin shape of the curve. This means the economy
must give up larger and larger amounts of rockets to get constant added amounts of
automobiles—and vice versa.
(c) The economy is underutilizing its available resources. The assumption of full
employment has been violated.
(d) Production outside the curve cannot occur (consumption outside the curve could occur
through foreign trade). To produce beyond the current production possibilities curve this
economy must realize an increase in its available resources and/or technology.
.
1-11 (Key Question) Specify and explain the typical shapes of the marginal-benefit and marginal-
cost curves. How are these curves used to determine the optimal allocation of resources to a
particular product? If current output is such that marginal cost exceeds marginal benefit,
should more or fewer resources be allocated to this product? Explain.
The marginal benefit curve is downward sloping, MB falls as more of a product is consumed
because additional units of a good yield less satisfaction than previous units. The marginal
cost curve is upward sloping, MC increases as more of a product is produced since additional
units require the use of increasingly unsuitable resource. The optimal amount of a particular
product occurs where MB equals MC. If MC exceeds MB, fewer resources should be
allocated to this use. The resources are more valuable in some alternative use (as reflected in
the higher MC) than in this use (as reflected in the lower MB).
1-13 (Key Question) Suppose improvement occurs in the technology of producing forklifts but not
in the technology of producing automobiles. Draw the new production possibilities curve.
Now assume that a technological advance occurs in producing automobiles but not in
producing forklifts. Draw the new production possibilities curve. Now draw a production
possibilities curve that reflects technological improvement in the production of both products.
See the graph for question 1-10. PPC1 shows improved forklift technology. PPC2 shows
improved auto technology. PPC3 shows improved technology in producing both products.
1-14 (Key Question) On average, households in China save 40 percent of their annual income
each year, whereas households in the Canada save less than 5 percent. Production
possibilities are growing at roughly 9 percent annually in China and 3.5 percent in Canada.
Copyright © 2007 McGraw-Hill 4 of 52