Applied Multivariate Data Analysis - Erasmus University Rotterdam
Academic Year 2025-26
114 Multiple-Choice Practice Questions
- always one correct answer option
- no calculator needed (only simple mental arithmetic will be done)
- no formula sheet needed (but I tried to make the questions resemble
the exam: so, you do need to know how simpler things are calculated,
such as R2, standard error, SS, etc.)
- includes materials from the lectures and tutorial exercises (and a few
from the Field book too)
- they are in the same order as they appear in the course materials, so
you can find where the questions (and most tables & figures) come
from if you go through the lectures and exercises in order
- answer sheet on last page
- incorrect answer options are not random; they help identify common
mistakes, so try to reason why each of them are incorrect, and this will
make going through these questions much more valuable
- good luck :)
IMPORTANT NOTE
I made these questions based on what I found more challenging in this course.
So, don’t be discouraged if you don’t get a high score on this test, but rather, use
it to help identify what you need to understand a bit more in depth.
This means that these questions are probably not representative of how difficult
the actual exam will be, because I didn’t include questions that I thought would
be very easy to answer.
Feel free to take a look at the first 2 pages to get an idea of what kind of
questions there are in the rest of this document :)
,1. Consider the following statements.
I. The standard error is the standard deviation of the sampling distribution.
II. A sampling distribution is a distribution of sample means.
a) I. is true, II. is false
b) I. is false, II. is true
c) both I. and II. are true
d) both I. and II. are false
2. Which of the following statements is false according to the central limit theorem about the
consequences of increase in N?
a) the standard error is smaller
b) the sample mean is more representative of the population
c) the shape of the sampling distribution resembles more the shape of the population distribution
d) the boundaries in which we believe the population mean lies is narrower
3. When calculating a confidence interval, we found a margin of error of 2, and a point estimate of 5.
What is the correct implication of these results?
a) The confidence interval is [-3;7]
b) 95% of the values in the population lie within our confidence interval of [3;7]
c) we can be 95% confident that our point estimate is no more than 5 values from the true value in
the population
d) we can be 95% confident that our point estimate is no more than 2 values from the true value in
the population
4. Which of the following pairs of statements are correct about confidence intervals and significance?
a) any value outside a 95% CI has p <.05 & if the value of a parameter in the null hypothesis is
outside the 95% CI, we reject H0
b) any value outside a 95% CI has p >.05 & if the value of a parameter in the null hypothesis is
outside the 95% CI, we reject H0
c) any value outside a 95% CI has p <.05 & if our test statistic falls outside the interval, the null
hypothesis can be rejected.
d) any value outside a 95% CI has p >.05 & if our test statistic falls within the interval, the null
hypothesis is true.
5. Complete the table below.
a) α = Type II error; β = Type I error; 1-α = correct decision; 1-β = Power, correct decision
b) α = Type I error; β = Type II error; 1-α = correct decision; 1-β = Power, correct decision
c) α = Type I error; β = Type II error; 1-α = Power, correct decision; 1-β = correct decision
d) α = Type II error; β = Type I error; 1-α = Power, correct decision; 1-β = correct decision
, 6. Consider the following statements:
I. A ____ tells you whether an effect is statistically detectable
II. A _____ depends on variance within the data
III. A _____ depends on sample size
a) I. test statistic; II: variance accounted for (R2), III. test statistic
b) I. test statistic; II: variance accounted for (R2), III. variance accounted for (R2)
c) I. variance accounted for (R2); II: variance accounted for (R2), III. test statistic
d) I. test statistic; II: test statistic; III. test statistic
7. As the sample size increases, _____ tends to get bigger
a) the p-value
b) the effect size
c) the test statistic
d) the confidence interval
8. Multiple testing directly results in:
a) a higher chance of Type 1 Error
b) a higher chance of Type II Error
c) more power
d) less power
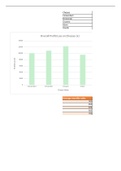
Table 1.
9. How can the value of 16.339 in Table 1. be best described?
a) it is the value of X when Y = 0
b) it is the value of Y when X = 0
c) it is the point at which the regression line crosses the X-axis
d) it is the mean of Y
10. Which of the listed values from Table 1. are not dependent on the unit of measurement of the
variables?
a) 16.339
b) 0.354
c) 0.096
d) 9.687
11. What is the value of beta for the intercept in Table 1.?
a) 0
b) 1
c) 16.339 divided by 1.687
d) there is not enough information given to answer this question
12. The regression line always passes through which values?
a) 0, b0, 𝑥̅ , 𝑦
b) 0, b1, 𝑥̅ , 𝑦
c) b0, 𝑥̅ , 𝑦
d) b0, 𝑥̅
Academic Year 2025-26
114 Multiple-Choice Practice Questions
- always one correct answer option
- no calculator needed (only simple mental arithmetic will be done)
- no formula sheet needed (but I tried to make the questions resemble
the exam: so, you do need to know how simpler things are calculated,
such as R2, standard error, SS, etc.)
- includes materials from the lectures and tutorial exercises (and a few
from the Field book too)
- they are in the same order as they appear in the course materials, so
you can find where the questions (and most tables & figures) come
from if you go through the lectures and exercises in order
- answer sheet on last page
- incorrect answer options are not random; they help identify common
mistakes, so try to reason why each of them are incorrect, and this will
make going through these questions much more valuable
- good luck :)
IMPORTANT NOTE
I made these questions based on what I found more challenging in this course.
So, don’t be discouraged if you don’t get a high score on this test, but rather, use
it to help identify what you need to understand a bit more in depth.
This means that these questions are probably not representative of how difficult
the actual exam will be, because I didn’t include questions that I thought would
be very easy to answer.
Feel free to take a look at the first 2 pages to get an idea of what kind of
questions there are in the rest of this document :)
,1. Consider the following statements.
I. The standard error is the standard deviation of the sampling distribution.
II. A sampling distribution is a distribution of sample means.
a) I. is true, II. is false
b) I. is false, II. is true
c) both I. and II. are true
d) both I. and II. are false
2. Which of the following statements is false according to the central limit theorem about the
consequences of increase in N?
a) the standard error is smaller
b) the sample mean is more representative of the population
c) the shape of the sampling distribution resembles more the shape of the population distribution
d) the boundaries in which we believe the population mean lies is narrower
3. When calculating a confidence interval, we found a margin of error of 2, and a point estimate of 5.
What is the correct implication of these results?
a) The confidence interval is [-3;7]
b) 95% of the values in the population lie within our confidence interval of [3;7]
c) we can be 95% confident that our point estimate is no more than 5 values from the true value in
the population
d) we can be 95% confident that our point estimate is no more than 2 values from the true value in
the population
4. Which of the following pairs of statements are correct about confidence intervals and significance?
a) any value outside a 95% CI has p <.05 & if the value of a parameter in the null hypothesis is
outside the 95% CI, we reject H0
b) any value outside a 95% CI has p >.05 & if the value of a parameter in the null hypothesis is
outside the 95% CI, we reject H0
c) any value outside a 95% CI has p <.05 & if our test statistic falls outside the interval, the null
hypothesis can be rejected.
d) any value outside a 95% CI has p >.05 & if our test statistic falls within the interval, the null
hypothesis is true.
5. Complete the table below.
a) α = Type II error; β = Type I error; 1-α = correct decision; 1-β = Power, correct decision
b) α = Type I error; β = Type II error; 1-α = correct decision; 1-β = Power, correct decision
c) α = Type I error; β = Type II error; 1-α = Power, correct decision; 1-β = correct decision
d) α = Type II error; β = Type I error; 1-α = Power, correct decision; 1-β = correct decision
, 6. Consider the following statements:
I. A ____ tells you whether an effect is statistically detectable
II. A _____ depends on variance within the data
III. A _____ depends on sample size
a) I. test statistic; II: variance accounted for (R2), III. test statistic
b) I. test statistic; II: variance accounted for (R2), III. variance accounted for (R2)
c) I. variance accounted for (R2); II: variance accounted for (R2), III. test statistic
d) I. test statistic; II: test statistic; III. test statistic
7. As the sample size increases, _____ tends to get bigger
a) the p-value
b) the effect size
c) the test statistic
d) the confidence interval
8. Multiple testing directly results in:
a) a higher chance of Type 1 Error
b) a higher chance of Type II Error
c) more power
d) less power
Table 1.
9. How can the value of 16.339 in Table 1. be best described?
a) it is the value of X when Y = 0
b) it is the value of Y when X = 0
c) it is the point at which the regression line crosses the X-axis
d) it is the mean of Y
10. Which of the listed values from Table 1. are not dependent on the unit of measurement of the
variables?
a) 16.339
b) 0.354
c) 0.096
d) 9.687
11. What is the value of beta for the intercept in Table 1.?
a) 0
b) 1
c) 16.339 divided by 1.687
d) there is not enough information given to answer this question
12. The regression line always passes through which values?
a) 0, b0, 𝑥̅ , 𝑦
b) 0, b1, 𝑥̅ , 𝑦
c) b0, 𝑥̅ , 𝑦
d) b0, 𝑥̅