EXAMINATION MEMOS
MAY/JUNE 2020 EXAM PREPARATION
MACROECONOMICS
ECS2602
MEMOS FROM 2020-2017
Call Ranga 0618441387 / for assistance on the module
,
, 1
ECS2602
GUIDELINES TO ANSWER THE OCT/NOV 2019 EXAMINTION PAPER:
Unique number 474911
SECTION A: COMPULSORY (60 marks: 30 x 2 = 60)
QUESTION 1 (5 marks) (x2 = 10 marks)
a. It is where the change in G is equal to the change in T (∆G = ∆T) and the equal increase
in government spending and taxes will still have a stimulatory impact on the level of output
and income
.
b.
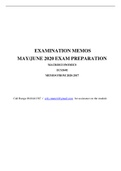
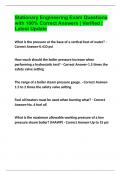
DIAGRAM:
Value 200 must correlate with 1000 and
Value 120 must correlate with 600 (check equilibrium point where ZZ intersect 450 line)
BACKGROUND:
Value of the multiplier is 1 –10.8 = 5.
Assume G↑ with 100 and T↑ with 100.
Given: G = 100 and Y = 500 on the diagram.
G↑ with 100: increase in income is therefore 5 x 100 = 500 and Y0 = 500 + 500 = 1 000)
T↑ with R100: change in autonomous spending is c(T) = 0.8(100) = 80 and Y0 = 80 x 5 = 400.
Then Y0 = 500 + 400 = 900.
, 2
The net effect is 100 [calculation: Y0 = 1 000 – (80 x 5) = 1 000 – 400 = 600]
NOTE: Student can also use Y0 = α (c0 + Ī + G – cT)
OR
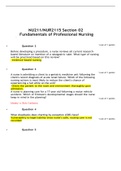
DIAGRAM: Value 120 must correlate with 600
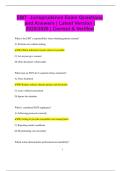
QUESTION 2 (2 marks) (x2 = 4 marks)
The interest rate and the level of output and income are two important variables that influence
the demand for money.
Use the following demand for money curve to explain the impact of (i) the interest rate and (ii)
the level of output and income on the demand for money.
Clearly indicate on the diagram the shifts and/or movement along the curve(s).
MAY/JUNE 2020 EXAM PREPARATION
MACROECONOMICS
ECS2602
MEMOS FROM 2020-2017
Call Ranga 0618441387 / for assistance on the module
,
, 1
ECS2602
GUIDELINES TO ANSWER THE OCT/NOV 2019 EXAMINTION PAPER:
Unique number 474911
SECTION A: COMPULSORY (60 marks: 30 x 2 = 60)
QUESTION 1 (5 marks) (x2 = 10 marks)
a. It is where the change in G is equal to the change in T (∆G = ∆T) and the equal increase
in government spending and taxes will still have a stimulatory impact on the level of output
and income
.
b.
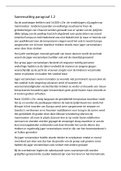
DIAGRAM:
Value 200 must correlate with 1000 and
Value 120 must correlate with 600 (check equilibrium point where ZZ intersect 450 line)
BACKGROUND:
Value of the multiplier is 1 –10.8 = 5.
Assume G↑ with 100 and T↑ with 100.
Given: G = 100 and Y = 500 on the diagram.
G↑ with 100: increase in income is therefore 5 x 100 = 500 and Y0 = 500 + 500 = 1 000)
T↑ with R100: change in autonomous spending is c(T) = 0.8(100) = 80 and Y0 = 80 x 5 = 400.
Then Y0 = 500 + 400 = 900.
, 2
The net effect is 100 [calculation: Y0 = 1 000 – (80 x 5) = 1 000 – 400 = 600]
NOTE: Student can also use Y0 = α (c0 + Ī + G – cT)
OR
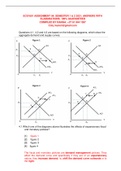
DIAGRAM: Value 120 must correlate with 600
QUESTION 2 (2 marks) (x2 = 4 marks)
The interest rate and the level of output and income are two important variables that influence
the demand for money.
Use the following demand for money curve to explain the impact of (i) the interest rate and (ii)
the level of output and income on the demand for money.
Clearly indicate on the diagram the shifts and/or movement along the curve(s).