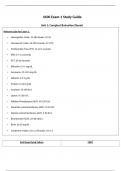
STAT 200 EXAM 2 STUDY GUIDE 2026 SOLVED
QUESTIONS
◉ Standard Deviation. Answer: Sensitive to outliers and skewness.
◉ Standard Deviation. Answer: If variability increases → then SD
increases.
◉ Five-Number Summary. Answer: Minimum, Q1, Median, Q3,
Maximum.
◉ Five-Number Summary. Answer: Basis for boxplots.
◉ Five-Number Summary. Answer: If asked to describe distribution
using quartiles → then use the five-number summary.
◉ Z-Score. Answer: Number of standard deviations a value is from
the mean.
◉ Z-Score. Answer: Positive = above mean, Negative = below mean.
◉ Z-Score. Answer: If |z| > 2 → then the value is unusual.
, ◉ Empirical Rule. Answer: 68%, 95%, 99.7% of data fall within 1, 2,
3 SD of the mean for bell-shaped data.
◉ Empirical Rule. Answer: Only applies to normal distributions.
◉ Empirical Rule. Answer: If data are skewed → then do NOT use the
rule.
◉ Histogram. Answer: Graph of quantitative data showing
distribution shape.
◉ Histogram. Answer: Bars touch; displays skew, symmetry,
modality.
◉ Histogram. Answer: If asked about shape → then use the
histogram.
◉ Boxplot. Answer: Graph showing quartiles, median, spread, and
outliers.
◉ Boxplot. Answer: Outliers shown as dots beyond whiskers.