Lecture 1 – Introduction
Prior knowledge before starting the course
- Hypotheses
- Falsification
- Dependent and independent variables
- Sample/population
- Statistical inference
- Levels of measurement: Nominal, Ordinal, Interval,
Ratio
- Unit of analysis
o About whom or what the researcher wants to make an inference
- Reliability
o Reliable way of measuring is often characterised by a normal
distribution of the measuring units. A reliable research is
reproducible.
- Validity
o Valid way of measuring means you are actually measuring the
phenomenon that you try to measure
- Mean
- Variance
- Standard deviation
- Standard error
- P-value
- Confidence interval
o The confidence interval tells us with how much certainty (e.g. 95%)
we can say that our measure is true for the entire population. We
also say in between which values (the interval) we expect the
number (e.g. the mean) to be. These values are based on the alpha
we choose and the standard deviation.
- T-test
- One-way ANOVA
o One-way Analysis Of Variance is used to determine whether there
are any significant differences between the means of two or more
unrelated groups. (For example, testing whether exam performance
difference is based on anxiety levels, three groups: low, medium
and high-stressed. Comparing their grade means)
- Pearson’s correlation
o A number between -1 and 1 that indicates the extent to which two
variables are linearly related
- Sampling distribution
o The frequency distribution of a statistic over many random samples
from a single population.
o The sample mean will vary from sample to sample; the way this
variation occurs is described by the “sampling distribution” of the
mean
- Central Limit Theorem (CLT)
o Sampling distribution will approach normal distribution as sample
size n increases (roughly if n > 30).
1
,2
,Lecture 2 – Basic Statistics
Central tendency
- A statistic that tells you something about the distribution and the centre of
this distribution of a variable
- Mean, median, mode
- Population mean = =
- Sample mean = =
Deviation scores
- Other definition of the mean: The mean is the value in the distribution of
the variable with the smallest possible sum of squared deviation scores.
The maximum scores have the smallest possible distance to the mean.
- Deviation score: How far are the scores away from the mean? =
- The sum of the positive and negative deviation scores is 0. If you want to
say anything about the degree of deviation, we look at the squares of the
scores (minus * minus = plus), so the minuses will be removed = x i2
Dispersion
- Descriptive statistics for variability of a variable
- Variance, standard deviation, range, interquartile range
- Population variance = =
- Sample variance = =
- Population standard deviation = =
- Sample standard deviation = =
Degrees of freedom: How much unique information can you find in a given
dataset? When you have 4 known scores, you always know the 5 th one, because
you know e.g. the mean, so n – 1.
Statistical inferences
- How to get from sample scores to population scores.
- We can use the sample mean as a (point) estimate (statistic) to make
inferences about the population parameter.
- Point estimate: Point means single number.
- Sample mean is an estimate of the population mean
- Central Limit Theorem (CLT): Normally distributed when n > 30.
How reliable is as an estimate of ?
- The sampling distribution for
o The distribution for all values for we get by drawing al possible
samples from the population
o The mean of all these mean values is identical to the population
mean
E( ) = (Expected value of the population mean)
3
, - We know something about the central tendency of the sampling
distribution
o What about the dispersion of the sampling distribution?
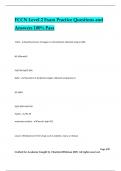
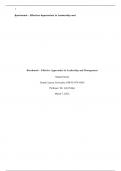
Standard error
- = standard error of the mean =
standard deviation of sample
means from
- Difference standard deviation and
standard error:
- The standard error is related to
the population standard deviation
:
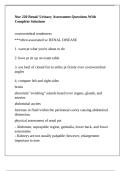
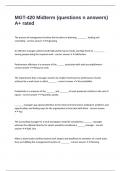
Central Limit Theorem
- CLT: Sampling distribution for
mean will approach normal
distribution as sample size n
increases
o Even is original distribution
of the variable is not normal
o Roughly if n > 30
o This means we can use the
normal distribution to know
how likely different values
for are for any
Possible values for are normally distributed around with
dispersion given by
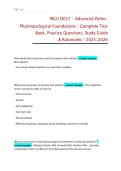
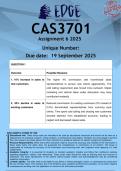
Confidence interval
- In practice, we never have all possible samples, just one sample
- But we can use our knowledge about sampling distribution to create a
confidence interval around , for instance:
There is a 95% chance that the population mean falls in the range
- Problem: if we have just one sample, we don’t actually know the standard
error, we only know that
- But standard error is related to the population and the standard deviation
- Sample standard deviation s is a good approximation of standard deviation
of the population
o So we can calculate an estimate of the standard error:
- Because we can use an estimate for the standard error, we must think of
the sampling distribution to follow the student’s t-distribution instead of
the normal distribution.
o T-distribution is like a normal distribution, but just more spread out
4
Prior knowledge before starting the course
- Hypotheses
- Falsification
- Dependent and independent variables
- Sample/population
- Statistical inference
- Levels of measurement: Nominal, Ordinal, Interval,
Ratio
- Unit of analysis
o About whom or what the researcher wants to make an inference
- Reliability
o Reliable way of measuring is often characterised by a normal
distribution of the measuring units. A reliable research is
reproducible.
- Validity
o Valid way of measuring means you are actually measuring the
phenomenon that you try to measure
- Mean
- Variance
- Standard deviation
- Standard error
- P-value
- Confidence interval
o The confidence interval tells us with how much certainty (e.g. 95%)
we can say that our measure is true for the entire population. We
also say in between which values (the interval) we expect the
number (e.g. the mean) to be. These values are based on the alpha
we choose and the standard deviation.
- T-test
- One-way ANOVA
o One-way Analysis Of Variance is used to determine whether there
are any significant differences between the means of two or more
unrelated groups. (For example, testing whether exam performance
difference is based on anxiety levels, three groups: low, medium
and high-stressed. Comparing their grade means)
- Pearson’s correlation
o A number between -1 and 1 that indicates the extent to which two
variables are linearly related
- Sampling distribution
o The frequency distribution of a statistic over many random samples
from a single population.
o The sample mean will vary from sample to sample; the way this
variation occurs is described by the “sampling distribution” of the
mean
- Central Limit Theorem (CLT)
o Sampling distribution will approach normal distribution as sample
size n increases (roughly if n > 30).
1
,2
,Lecture 2 – Basic Statistics
Central tendency
- A statistic that tells you something about the distribution and the centre of
this distribution of a variable
- Mean, median, mode
- Population mean = =
- Sample mean = =
Deviation scores
- Other definition of the mean: The mean is the value in the distribution of
the variable with the smallest possible sum of squared deviation scores.
The maximum scores have the smallest possible distance to the mean.
- Deviation score: How far are the scores away from the mean? =
- The sum of the positive and negative deviation scores is 0. If you want to
say anything about the degree of deviation, we look at the squares of the
scores (minus * minus = plus), so the minuses will be removed = x i2
Dispersion
- Descriptive statistics for variability of a variable
- Variance, standard deviation, range, interquartile range
- Population variance = =
- Sample variance = =
- Population standard deviation = =
- Sample standard deviation = =
Degrees of freedom: How much unique information can you find in a given
dataset? When you have 4 known scores, you always know the 5 th one, because
you know e.g. the mean, so n – 1.
Statistical inferences
- How to get from sample scores to population scores.
- We can use the sample mean as a (point) estimate (statistic) to make
inferences about the population parameter.
- Point estimate: Point means single number.
- Sample mean is an estimate of the population mean
- Central Limit Theorem (CLT): Normally distributed when n > 30.
How reliable is as an estimate of ?
- The sampling distribution for
o The distribution for all values for we get by drawing al possible
samples from the population
o The mean of all these mean values is identical to the population
mean
E( ) = (Expected value of the population mean)
3
, - We know something about the central tendency of the sampling
distribution
o What about the dispersion of the sampling distribution?
Standard error
- = standard error of the mean =
standard deviation of sample
means from
- Difference standard deviation and
standard error:
- The standard error is related to
the population standard deviation
:
Central Limit Theorem
- CLT: Sampling distribution for
mean will approach normal
distribution as sample size n
increases
o Even is original distribution
of the variable is not normal
o Roughly if n > 30
o This means we can use the
normal distribution to know
how likely different values
for are for any
Possible values for are normally distributed around with
dispersion given by
Confidence interval
- In practice, we never have all possible samples, just one sample
- But we can use our knowledge about sampling distribution to create a
confidence interval around , for instance:
There is a 95% chance that the population mean falls in the range
- Problem: if we have just one sample, we don’t actually know the standard
error, we only know that
- But standard error is related to the population and the standard deviation
- Sample standard deviation s is a good approximation of standard deviation
of the population
o So we can calculate an estimate of the standard error:
- Because we can use an estimate for the standard error, we must think of
the sampling distribution to follow the student’s t-distribution instead of
the normal distribution.
o T-distribution is like a normal distribution, but just more spread out
4