AS level economics past paper 1 section A
1.(a) Define the term 'national income'.: total spending on goods and services.
2.(b) Which one of the following is an injection into the circular flow of income?-
: investment
3.(c) Define the term 'circular flow of income'.
ans:
// flows around the // between // and //. Withdrawals are //, //, //. Injections also include
// //, //.: Money flows around the economy between consumers and firms. Withdrawals
are taxation, savings, imports. Injections also include government spending, exports.
4.Define the term 'purchasing power parities'.
ans:
The // at which the // of one // would have to be // into that of another // to // the //
amount of // and // in each //. It is a // between //, taking // account //
cost of //.: The rate at which the currency of one country would have to be converted into
that of another country to buy the same amount of goods and services in each country. It
is a comparison between countries, taking into account different cost of living.
5.The table below shows GDP per capita at purchasing power parities (PPPs) for a
selection of European countries in 2013. country - GDP per capita (US$, at PPPs, 2013,
rounded)
UK - 38 500
SPAIN - 33 000
ITALY - 35 500
(b) The Office for National Statistics estimates that the UK population was 64 million in
2013. Using the data, what was the UK's total GDP in 2013?: $2 464 000 million
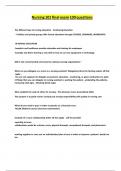
6.c) Diagram A shows the aggregate demand and aggregate supply for a country. Describe
actual economic growth on Diagram A.: AD curve moves rightwards
(AD -> AD1)
Real GDP moves rightwards
(Y1 -> Y2)
Price level moves up (P1 -> P2).
New equilibrium at Y2
7.(a) Define the term 'claimant count'.
, AS level economics past paper 1 section A
ans:// of people // // //: Number of people claiming
unemployment benefit 8. The table below shows claimant count
data for the UK. aug 2014 number of claimants - 961 149
Feb 2015 numb of claimants - 858 344
(b) Calculate the percentage change in the claimant count from August 2014 to February
2015.: -10.7%
9. (c) Which one of the following is likely to cause a reduction in the claimant count?: a
compulsory weekly interview for every claimant
10. 4 Figure 1 shows data on the UK's balance of trade.Figure 1 - UK's balance of trade
January 2013 to January 2015
£ billion, seasonally adjusted
(a) Which one of the following can be inferred from Figure 1 in the period shown?: The
trade in goods deficit was the smallest in June 2013
11. b) Explain one likely reason for the reduction in the total UK trade deficit in January
2015. ans:
The // oil price would // the // of //. This is // by the data from Figure 1, which // that the
trade // was // £1 billion in // 2015. Furthermore, the // in the // of the
// makes exports // & imports more //. This // have led to an // in // for UK //,
thereby // the trade deficit.: The falling oil price would reduce the cost of imports. This is
supported by the data from Figure 1, which indicates that the trade deficit was
approximately £1 billion in January 2015. Furthermore, the fall in the value of the pound
makes exports cheaper & imports more expensive. This could have led to an increase in
demand for UK exports, thereby reducing the trade deficit.
12. 5. In 2014 the Bank of England estimated the marginal propensity to consume of UK
consumers to be 0.5.
In 2014 the Chancellor of the Exchequer announced a £15 billion investment programme
into UK road infrastructure.
(a) Using the information above, calculate the total increase in national income, resulting
from the £15 billion investment.: multiplier = 1/(1 - 0.5) = 2
15 billion x 2
=
£30 billion
1.(a) Define the term 'national income'.: total spending on goods and services.
2.(b) Which one of the following is an injection into the circular flow of income?-
: investment
3.(c) Define the term 'circular flow of income'.
ans:
// flows around the // between // and //. Withdrawals are //, //, //. Injections also include
// //, //.: Money flows around the economy between consumers and firms. Withdrawals
are taxation, savings, imports. Injections also include government spending, exports.
4.Define the term 'purchasing power parities'.
ans:
The // at which the // of one // would have to be // into that of another // to // the //
amount of // and // in each //. It is a // between //, taking // account //
cost of //.: The rate at which the currency of one country would have to be converted into
that of another country to buy the same amount of goods and services in each country. It
is a comparison between countries, taking into account different cost of living.
5.The table below shows GDP per capita at purchasing power parities (PPPs) for a
selection of European countries in 2013. country - GDP per capita (US$, at PPPs, 2013,
rounded)
UK - 38 500
SPAIN - 33 000
ITALY - 35 500
(b) The Office for National Statistics estimates that the UK population was 64 million in
2013. Using the data, what was the UK's total GDP in 2013?: $2 464 000 million
6.c) Diagram A shows the aggregate demand and aggregate supply for a country. Describe
actual economic growth on Diagram A.: AD curve moves rightwards
(AD -> AD1)
Real GDP moves rightwards
(Y1 -> Y2)
Price level moves up (P1 -> P2).
New equilibrium at Y2
7.(a) Define the term 'claimant count'.
, AS level economics past paper 1 section A
ans:// of people // // //: Number of people claiming
unemployment benefit 8. The table below shows claimant count
data for the UK. aug 2014 number of claimants - 961 149
Feb 2015 numb of claimants - 858 344
(b) Calculate the percentage change in the claimant count from August 2014 to February
2015.: -10.7%
9. (c) Which one of the following is likely to cause a reduction in the claimant count?: a
compulsory weekly interview for every claimant
10. 4 Figure 1 shows data on the UK's balance of trade.Figure 1 - UK's balance of trade
January 2013 to January 2015
£ billion, seasonally adjusted
(a) Which one of the following can be inferred from Figure 1 in the period shown?: The
trade in goods deficit was the smallest in June 2013
11. b) Explain one likely reason for the reduction in the total UK trade deficit in January
2015. ans:
The // oil price would // the // of //. This is // by the data from Figure 1, which // that the
trade // was // £1 billion in // 2015. Furthermore, the // in the // of the
// makes exports // & imports more //. This // have led to an // in // for UK //,
thereby // the trade deficit.: The falling oil price would reduce the cost of imports. This is
supported by the data from Figure 1, which indicates that the trade deficit was
approximately £1 billion in January 2015. Furthermore, the fall in the value of the pound
makes exports cheaper & imports more expensive. This could have led to an increase in
demand for UK exports, thereby reducing the trade deficit.
12. 5. In 2014 the Bank of England estimated the marginal propensity to consume of UK
consumers to be 0.5.
In 2014 the Chancellor of the Exchequer announced a £15 billion investment programme
into UK road infrastructure.
(a) Using the information above, calculate the total increase in national income, resulting
from the £15 billion investment.: multiplier = 1/(1 - 0.5) = 2
15 billion x 2
=
£30 billion