Geographical Information Systems
Hoorcollege 1
GIS allows us to collect, manipulate, analyze, and display spatial data and information. Spatial data is any data that deals with
locations of things. GIS is used with everything that has a spatial component.
GIS; system with components; software, people, data, procedures, hardware, connected by network.
GIS stores data as a collection of thematic layers (=what, and geometric layer=where)
GIS is a powerful set of tools for collecting, storing, retrieving, transforming and displaying spatial data from real world.
Two components:
• Geographical position
• Attribute information; Data which isn’t inherent to geometry. (stored in database-table)
To link attributes to geometry a unique join field is required: ID field.
Two respresentation data models:
•Vector data model, discrete objects (e.g. Clear boundaries, trees, Units, lines). Discrete; several neighboring phenomena
- ‘Discrete objects’: points, lines and polygons (areas)
- Represented as sequences of coordinates (vertices)
- To every object an attribute table can be connected.
Vector advantages Vector disadvantages
- Efficient data storage (±10% compared to raster data) - Complex data-structure
- Topological analyses are more efficient/only possible - Precision of boundaries can be misleading
- Greater precision and accuracy - Combining maps (overlays) slow
- Greater flexibility in storing & manipulating attribute data - Production of maps is time-consuming (expensive)
•Raster data model; Continuous phenomena represents real world as finite numbers of variables (e.g. temperature, slope).
Continuous; one omnipresent phenom. Raster model; rows and columns with numbers (matrix). Every cell in a raster has a value.
To every value an attribute can be connected. Raster data stored as an array of values. Data resolution (detail) controlled by cell size
Raster advantages Raster disadvantages
- Suitable for data with high spatial variability - Topological relationships are not explicit, that makes some
- Spatial analysis often simpler and faster analyses more difficult
- Some types of analysis only possible with raster - Requires huge computer memory for high resolutions
- Easy to integrate with satellite data - Poor cartographical presentation
Extent is the area covered by the data
Resolution is the amount of space that is covered by single observations in the data
Scale; Size of objects displayed on a map as a fraction of their real-world sizes (1:1000 every cm on paper is 1000 cm real world)
Logistics; getting the right stuff, to the right place, at the right time
Track & Trace; concerns a process of determining the current and past locations (and other info) of a unique item or property.
Use of location awareness; localization, alert/geofencing, navigation, tracking
Location types;
- Coordinates (2D & 3D)
- Chokepoints
- Proximity
- Presence
Collect Data (Landuse) > Prepare Data (ArcGIS) > Convert Data (python)
Examples of application for added value of location in environmental or business process; Navigation, Google maps, UPS
BOOK:
- The key GIS representation issues are what to represent and how to represent it.
- Geographic attributes are classified as nominal, ordinal, interval, ratio, and cyclic
- Weeding is the process of simplifying a line or area by reducing the number of points in its representation
Steps; Ranking or prioritization
1. Define the problem or goal
2. Decide on evaluation criteria
3. Normalize and create utility scales
4. Define weights for criteria
5. Calculate a ranking model result
6. Evaluate result and perform sensitivity analysis
, Hoorcollege 2 Spatial Analysis
Spatial analysis is the crux of GIS: ➢adding value to geographic data
➢turning data into useful information
Spatial Analysis – Components
• Visualization => Showing interesting patterns
• Exploratory Spatial Data Analysis => Finding interesting patterns
• Spatial Modeling, Regression => Explaining interesting patterns
Types of Spatial Analysis
1 – Queries; GIS is used to answer simple questions (no new data produced).
2 – Measurements; numerical values that describe aspects of geographic data. Include measurement of simple properties of objects
(vb. length) and of relationships between pairs of objects (vb. distance)
3 – Transformations; methods of spatial analysis that changes, combines or compares datasets to obtain new datasets (new insights)
Transformations uses geometric, arithmetic or logical rules. Include operations that convert data (raster ⇔ vector). Can also create
fields from collections of objects.
Queries – by Attribute or Location
Spatial selection - Identifying features based on spatial criteria like adjacency, connectivity, containment
- Dissolve; dissolve multiple areas into one with similar characteristics (e.g. A’dam-West assigned 1, rest 0)
- Buffer; Create new object consisting of areas within a user- defined distance of an existing object (e.g., to determine
areas impacted by something). Feasible in either vector or raster mode (using expand or distance functions)
Dissolve Buffer
Rasters Analysis!!! Different Operations;
• Local; Operations performed on a cell by cell basis.
Map algebra (+, -, *, :) or Functions (log, sin, cos, tan).
Logical operators screening (AND, OR) and ranking (MIN, MAX).
Reclassify.
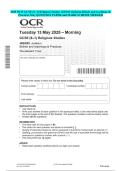
• Focal; Operations performed using a moving group of cells (kernel of neighborhood; sum, average, max, min, deviation)
•
Focal Neighborhood Focal SUM
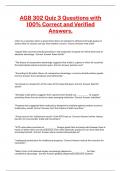
• Zonal; Operations performed using zones (groups of cells having the same value)
Calculations for “Zones”
Sum, average, max, min, deviation
• Global; Operations performed using the whole grid
EXAM; Multiple types of spatial analysis discussed. Describe the purpose of zonal statistics and give example of how to use it?
Creating Rasters!!!!!!; Converting vector data to create raster layer
Hoorcollege 1
GIS allows us to collect, manipulate, analyze, and display spatial data and information. Spatial data is any data that deals with
locations of things. GIS is used with everything that has a spatial component.
GIS; system with components; software, people, data, procedures, hardware, connected by network.
GIS stores data as a collection of thematic layers (=what, and geometric layer=where)
GIS is a powerful set of tools for collecting, storing, retrieving, transforming and displaying spatial data from real world.
Two components:
• Geographical position
• Attribute information; Data which isn’t inherent to geometry. (stored in database-table)
To link attributes to geometry a unique join field is required: ID field.
Two respresentation data models:
•Vector data model, discrete objects (e.g. Clear boundaries, trees, Units, lines). Discrete; several neighboring phenomena
- ‘Discrete objects’: points, lines and polygons (areas)
- Represented as sequences of coordinates (vertices)
- To every object an attribute table can be connected.
Vector advantages Vector disadvantages
- Efficient data storage (±10% compared to raster data) - Complex data-structure
- Topological analyses are more efficient/only possible - Precision of boundaries can be misleading
- Greater precision and accuracy - Combining maps (overlays) slow
- Greater flexibility in storing & manipulating attribute data - Production of maps is time-consuming (expensive)
•Raster data model; Continuous phenomena represents real world as finite numbers of variables (e.g. temperature, slope).
Continuous; one omnipresent phenom. Raster model; rows and columns with numbers (matrix). Every cell in a raster has a value.
To every value an attribute can be connected. Raster data stored as an array of values. Data resolution (detail) controlled by cell size
Raster advantages Raster disadvantages
- Suitable for data with high spatial variability - Topological relationships are not explicit, that makes some
- Spatial analysis often simpler and faster analyses more difficult
- Some types of analysis only possible with raster - Requires huge computer memory for high resolutions
- Easy to integrate with satellite data - Poor cartographical presentation
Extent is the area covered by the data
Resolution is the amount of space that is covered by single observations in the data
Scale; Size of objects displayed on a map as a fraction of their real-world sizes (1:1000 every cm on paper is 1000 cm real world)
Logistics; getting the right stuff, to the right place, at the right time
Track & Trace; concerns a process of determining the current and past locations (and other info) of a unique item or property.
Use of location awareness; localization, alert/geofencing, navigation, tracking
Location types;
- Coordinates (2D & 3D)
- Chokepoints
- Proximity
- Presence
Collect Data (Landuse) > Prepare Data (ArcGIS) > Convert Data (python)
Examples of application for added value of location in environmental or business process; Navigation, Google maps, UPS
BOOK:
- The key GIS representation issues are what to represent and how to represent it.
- Geographic attributes are classified as nominal, ordinal, interval, ratio, and cyclic
- Weeding is the process of simplifying a line or area by reducing the number of points in its representation
Steps; Ranking or prioritization
1. Define the problem or goal
2. Decide on evaluation criteria
3. Normalize and create utility scales
4. Define weights for criteria
5. Calculate a ranking model result
6. Evaluate result and perform sensitivity analysis
, Hoorcollege 2 Spatial Analysis
Spatial analysis is the crux of GIS: ➢adding value to geographic data
➢turning data into useful information
Spatial Analysis – Components
• Visualization => Showing interesting patterns
• Exploratory Spatial Data Analysis => Finding interesting patterns
• Spatial Modeling, Regression => Explaining interesting patterns
Types of Spatial Analysis
1 – Queries; GIS is used to answer simple questions (no new data produced).
2 – Measurements; numerical values that describe aspects of geographic data. Include measurement of simple properties of objects
(vb. length) and of relationships between pairs of objects (vb. distance)
3 – Transformations; methods of spatial analysis that changes, combines or compares datasets to obtain new datasets (new insights)
Transformations uses geometric, arithmetic or logical rules. Include operations that convert data (raster ⇔ vector). Can also create
fields from collections of objects.
Queries – by Attribute or Location
Spatial selection - Identifying features based on spatial criteria like adjacency, connectivity, containment
- Dissolve; dissolve multiple areas into one with similar characteristics (e.g. A’dam-West assigned 1, rest 0)
- Buffer; Create new object consisting of areas within a user- defined distance of an existing object (e.g., to determine
areas impacted by something). Feasible in either vector or raster mode (using expand or distance functions)
Dissolve Buffer
Rasters Analysis!!! Different Operations;
• Local; Operations performed on a cell by cell basis.
Map algebra (+, -, *, :) or Functions (log, sin, cos, tan).
Logical operators screening (AND, OR) and ranking (MIN, MAX).
Reclassify.
• Focal; Operations performed using a moving group of cells (kernel of neighborhood; sum, average, max, min, deviation)
•
Focal Neighborhood Focal SUM
• Zonal; Operations performed using zones (groups of cells having the same value)
Calculations for “Zones”
Sum, average, max, min, deviation
• Global; Operations performed using the whole grid
EXAM; Multiple types of spatial analysis discussed. Describe the purpose of zonal statistics and give example of how to use it?
Creating Rasters!!!!!!; Converting vector data to create raster layer