Intro to GIS
H1: What is GIS? Spatial Data models
1.1. Some definitions
Geographic Information Systems (GIS) = computer-based tools designed to collect, store, retrieve, manipulate,
analyze, & display spatial data from real world for specific purposes. They integrate both spatial (geometric) & non-
spatial (thematic) data.
Definitions
• Toolset Perspective => GIS is powerful set of tools for collecting, storing, transforming, & displaying spatial data.
• Information Technology Perspective => GIS is IT that stores, analyzes & visualizes spatial & non-spatial data.
• Computer-Based System Perspective => GIS aids in collection, maintenance, storage, analysis, output, &
distribution of spatial data & info.
Important Elements
• Multi-Functionality => GIS performs tasks such as storing, manipulating, querying, analyzing, & visualizing data.
• Problem Solving & Policy Support => GIS is used to support decision-making & policy development.
• Digital Technology => Involves hardware, software, & procedures.
• Spatial & Non-Spatial Integration => Links geographic locations with descriptive attributes.
• Web & Wireless Access => Supports easier access, sharing, & integration into geographical data infrastructures.
Term GIS also refers to Geographic Information Science, research field involving GIS theory, methods, & applications.
=> GIS is system for handling geographic data & science that studies how best to use, analyze, & interpret that data.
1.2. Spatial and non-spatial data
1.2.1: Representation of Spatial Phenomena in GIS
Spatial phenomena or objects are always linked to location or set of locations (such as temperature, elevation,
buildings) or parcels. 2 Types of Data Characterizing Spatial Objects
• Spatial (Geometric) Data = location of object. => Typically represented by coordinate pairs or sets of coordinate
pairs.
• Non-Spatial (Thematic) Data / Attributes = characteristics of object. => Examples: temperature at location, total
population in area, land use of parcel.
=> Linking spatial & non-spatial data is essence of GIS & is what makes it more powerful than standard, non-spatial
info systems.
Organization & Visualization:
• Spatial objects are usually organized into layers (maps).
• Each layer can be analyzed independently or combined with other layers.
Vector Representation => Spatial objects are represented using points, lines, & polygons:
• Points = represent discrete locations (such as tree positions). Number of points can reflect
resolution of linear feature like river.
• Lines = sequences of ordered points representing linear features.
• Polygons = closed shapes; 1st point coincides with last point to close this polygon.
Attributes like height of buildings or trees are stored as thematic data, since GIS typically works
in 2D.
This separation allows flexible analysis => geometry defines where objects are & attributes describe what they are.
1.2.2: Representing non-spatial data (attributes)
,With non-spatial data, each shape has ID number & each ID is unique. You can then add
set of attributes to shapes (type, etc.).
You can place different layers on top of each other, click on them (layer is placed in folder)
or unclick them (layer disappears). You can add symbols, change colors, change line
thickness & fill.
1.2.3: Core Feature of GIS
Most essential characteristic of GIS is linking spatial & non-spatial data. This integration is what gives GIS its added
value over traditional info systems.
Typical Questions Answered by GIS
• Identification = What are characteristics of specific location or object? => Example: Identify owner of particular
parcel.
• Location = Where does certain phenomenon occur? => Example: Locate all non-built parcels within commune.
• Spatio-temporal Analysis = How has spatial phenomenon changed over time? => Example: Visualize expansion
of built-up areas since 1950.
• Overlay Analysis = Analyze spatial relationships between different phenomena. => Example: Determine number
of buildings within buffer zone around factory.
• Spatial Modeling = Compare or evaluate alternative scenarios; simulate outcomes. => Examples:
o Geo-marketing => Identify optimal location for shopping center based on accessibility & potential clients.
o Network Analysis => Simulate impact of traffic changes.
o 3D Terrain Analysis => Assess impact of large infrastructures (such as wind turbines), on landscape.
=> This shows that GIS is not just mapping tool, but powerful system for analysis, simulation, & decision support.
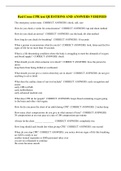
Layers in spatial database & Example of overlay analysis in GIS
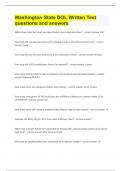
1.2.4: Layer Types in GIS
Spatial data are represented as layers, & there are 4 main types:
• Point = discrete locations (such as wells, trees, survey points).
• Line = linear features (such as roads, rivers, pipelines).
• Polygon = area features (such as parcels, lakes, land use zones).
• Raster = fields as grid of cells, each with 1 value (such as temperature,
elevation, satellite imagery).
Vector vs Raster
• Vector = Uses points, lines, & polygons to represent spatial objects. Each
object can have multiple attributes.
• Raster = Uses regular grid, similar to image. Each cell has 1 attribute value,
making it suitable for continuous data from sources like remote sensing.
,Raster & vector are essentially opposite ways of representing spatial data => vector for discrete objects, raster for
continuous fields.
1.3. Spatial data models
Spatial Data Models = Simplified Representation of Reality => Because reality is too complex to be captured in every
detail on map or in GIS, we use spatial data models to simplify & represent it. There are 2 fundamental approaches:
1) Field (Raster) Approach = Terrain is represented as set of attributes, where each attribute has value at every
location, forming continuous field.
• Application => Best for phenomena with continuous spatial variation (such as elevation, temperature, soil
moisture)
• Data collection => Attribute values are often measured at irregular set of sample points, chosen based on:
o Sampling design
o Spatial correlation between points
o Required accuracy
• Interpolation => Irregularly sampled data are often transformed into regular grid using interpolation methods.
• Spatial autocorrelation => Nearby points tend to have similar attribute values, reflecting principle that locations
close to each other are more likely to share characteristics.
=> Field approach forms foundation of raster GIS, where each grid cell contains single attribute value.
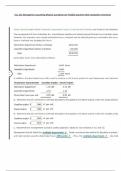
Example: To transformation attribute values for irregular set of locations into regular grid
=> You need to use raster image, & to go from L to R, you have to do extrapolation.
Interpolation based on “inverse distance weighting”
Distances are shown in purple & measured values in red, allowing you to calculate averages, etc.
2) Object-based Approach = Spatial phenomena are represented as discrete objects on terrain. For each object, both
geometric & thematic characteristics are recorded. Key points:
• Object classes are defined, & for each class, decision is made on how to represent objects spatially:
o Points for discrete locations (such as trees, wells)
o Lines for linear features (such as roads, rivers)
o Areas (polygons) for bounded surfaces (such as parcels, lakes)
• This method is suited for phenomena with clear boundaries & discrete spatial variation, (such as parcels,
buildings, & roads).
• Often, data is transformed from field-based model to object-based model for analysis & representation.
Examples:
, o Creating soil map from soil profile data
o Interpreting land use or vegetation from aerial or satellite imagery
o Building digital elevation model (DEM) from triangulated terrain data
=> Object approach is foundation of vector GIS, emphasizing identification & characterization of individual spatial
entities.
1.4. Digital representation of spatial data model
Spatial data can be digitally represented using 2 main methods.
1) Raster Method => Study area is covered by regular grid of cells. Each cell is assigned value representing its
thematic content, depending on type of model:
• Field-based model = Each cell is assigned value of attribute at its central location.
• Object-based model:
o Points = Cells containing point inherit point’s attribute value.
o Lines = Cells intersected by line take line’s attribute value.
o Areas = Cells receive value based on either:
▪ Attribute of central point of cell (central point method), or
▪ Attribute of dominant area covering most of cell (dominant unit method).
Raster method is particularly useful for continuous phenomena & supports efficient overlay & map algebra
operations.
Raster in GIS = grid-based representation of spatial phenomena, defined by several key properties:
• Origin coordinates = Location of raster’s reference point.
• Resolution (cell size) = Determines level of detail; smaller cells capture finer detail but increase data volume.
• Dimensions = Number of columns (x-direction) & rows (y-direction).
Each raster cell holds single attribute value corresponding to specific theme or variable. To represent multiple
themes, separate raster’s are created for each attribute, producing layered structure, where each layer corresponds
to 1 thematic variable.
Important considerations:
• All rasters used for overlay or comparative analysis must share same reference frame, resolution, & dimensions.
• Raster model simplifies overlay analysis, enabling efficient combination of multiple thematic layers. This was
basis for development of map algebra, which became fundamental tool for raster-based spatial analysis since
1960s.
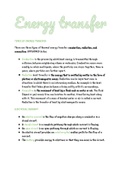
Creation of raster
Rasterizing error for central point (c, d) & dominant unit rasterizing (e, f)
H1: What is GIS? Spatial Data models
1.1. Some definitions
Geographic Information Systems (GIS) = computer-based tools designed to collect, store, retrieve, manipulate,
analyze, & display spatial data from real world for specific purposes. They integrate both spatial (geometric) & non-
spatial (thematic) data.
Definitions
• Toolset Perspective => GIS is powerful set of tools for collecting, storing, transforming, & displaying spatial data.
• Information Technology Perspective => GIS is IT that stores, analyzes & visualizes spatial & non-spatial data.
• Computer-Based System Perspective => GIS aids in collection, maintenance, storage, analysis, output, &
distribution of spatial data & info.
Important Elements
• Multi-Functionality => GIS performs tasks such as storing, manipulating, querying, analyzing, & visualizing data.
• Problem Solving & Policy Support => GIS is used to support decision-making & policy development.
• Digital Technology => Involves hardware, software, & procedures.
• Spatial & Non-Spatial Integration => Links geographic locations with descriptive attributes.
• Web & Wireless Access => Supports easier access, sharing, & integration into geographical data infrastructures.
Term GIS also refers to Geographic Information Science, research field involving GIS theory, methods, & applications.
=> GIS is system for handling geographic data & science that studies how best to use, analyze, & interpret that data.
1.2. Spatial and non-spatial data
1.2.1: Representation of Spatial Phenomena in GIS
Spatial phenomena or objects are always linked to location or set of locations (such as temperature, elevation,
buildings) or parcels. 2 Types of Data Characterizing Spatial Objects
• Spatial (Geometric) Data = location of object. => Typically represented by coordinate pairs or sets of coordinate
pairs.
• Non-Spatial (Thematic) Data / Attributes = characteristics of object. => Examples: temperature at location, total
population in area, land use of parcel.
=> Linking spatial & non-spatial data is essence of GIS & is what makes it more powerful than standard, non-spatial
info systems.
Organization & Visualization:
• Spatial objects are usually organized into layers (maps).
• Each layer can be analyzed independently or combined with other layers.
Vector Representation => Spatial objects are represented using points, lines, & polygons:
• Points = represent discrete locations (such as tree positions). Number of points can reflect
resolution of linear feature like river.
• Lines = sequences of ordered points representing linear features.
• Polygons = closed shapes; 1st point coincides with last point to close this polygon.
Attributes like height of buildings or trees are stored as thematic data, since GIS typically works
in 2D.
This separation allows flexible analysis => geometry defines where objects are & attributes describe what they are.
1.2.2: Representing non-spatial data (attributes)
,With non-spatial data, each shape has ID number & each ID is unique. You can then add
set of attributes to shapes (type, etc.).
You can place different layers on top of each other, click on them (layer is placed in folder)
or unclick them (layer disappears). You can add symbols, change colors, change line
thickness & fill.
1.2.3: Core Feature of GIS
Most essential characteristic of GIS is linking spatial & non-spatial data. This integration is what gives GIS its added
value over traditional info systems.
Typical Questions Answered by GIS
• Identification = What are characteristics of specific location or object? => Example: Identify owner of particular
parcel.
• Location = Where does certain phenomenon occur? => Example: Locate all non-built parcels within commune.
• Spatio-temporal Analysis = How has spatial phenomenon changed over time? => Example: Visualize expansion
of built-up areas since 1950.
• Overlay Analysis = Analyze spatial relationships between different phenomena. => Example: Determine number
of buildings within buffer zone around factory.
• Spatial Modeling = Compare or evaluate alternative scenarios; simulate outcomes. => Examples:
o Geo-marketing => Identify optimal location for shopping center based on accessibility & potential clients.
o Network Analysis => Simulate impact of traffic changes.
o 3D Terrain Analysis => Assess impact of large infrastructures (such as wind turbines), on landscape.
=> This shows that GIS is not just mapping tool, but powerful system for analysis, simulation, & decision support.
Layers in spatial database & Example of overlay analysis in GIS
1.2.4: Layer Types in GIS
Spatial data are represented as layers, & there are 4 main types:
• Point = discrete locations (such as wells, trees, survey points).
• Line = linear features (such as roads, rivers, pipelines).
• Polygon = area features (such as parcels, lakes, land use zones).
• Raster = fields as grid of cells, each with 1 value (such as temperature,
elevation, satellite imagery).
Vector vs Raster
• Vector = Uses points, lines, & polygons to represent spatial objects. Each
object can have multiple attributes.
• Raster = Uses regular grid, similar to image. Each cell has 1 attribute value,
making it suitable for continuous data from sources like remote sensing.
,Raster & vector are essentially opposite ways of representing spatial data => vector for discrete objects, raster for
continuous fields.
1.3. Spatial data models
Spatial Data Models = Simplified Representation of Reality => Because reality is too complex to be captured in every
detail on map or in GIS, we use spatial data models to simplify & represent it. There are 2 fundamental approaches:
1) Field (Raster) Approach = Terrain is represented as set of attributes, where each attribute has value at every
location, forming continuous field.
• Application => Best for phenomena with continuous spatial variation (such as elevation, temperature, soil
moisture)
• Data collection => Attribute values are often measured at irregular set of sample points, chosen based on:
o Sampling design
o Spatial correlation between points
o Required accuracy
• Interpolation => Irregularly sampled data are often transformed into regular grid using interpolation methods.
• Spatial autocorrelation => Nearby points tend to have similar attribute values, reflecting principle that locations
close to each other are more likely to share characteristics.
=> Field approach forms foundation of raster GIS, where each grid cell contains single attribute value.
Example: To transformation attribute values for irregular set of locations into regular grid
=> You need to use raster image, & to go from L to R, you have to do extrapolation.
Interpolation based on “inverse distance weighting”
Distances are shown in purple & measured values in red, allowing you to calculate averages, etc.
2) Object-based Approach = Spatial phenomena are represented as discrete objects on terrain. For each object, both
geometric & thematic characteristics are recorded. Key points:
• Object classes are defined, & for each class, decision is made on how to represent objects spatially:
o Points for discrete locations (such as trees, wells)
o Lines for linear features (such as roads, rivers)
o Areas (polygons) for bounded surfaces (such as parcels, lakes)
• This method is suited for phenomena with clear boundaries & discrete spatial variation, (such as parcels,
buildings, & roads).
• Often, data is transformed from field-based model to object-based model for analysis & representation.
Examples:
, o Creating soil map from soil profile data
o Interpreting land use or vegetation from aerial or satellite imagery
o Building digital elevation model (DEM) from triangulated terrain data
=> Object approach is foundation of vector GIS, emphasizing identification & characterization of individual spatial
entities.
1.4. Digital representation of spatial data model
Spatial data can be digitally represented using 2 main methods.
1) Raster Method => Study area is covered by regular grid of cells. Each cell is assigned value representing its
thematic content, depending on type of model:
• Field-based model = Each cell is assigned value of attribute at its central location.
• Object-based model:
o Points = Cells containing point inherit point’s attribute value.
o Lines = Cells intersected by line take line’s attribute value.
o Areas = Cells receive value based on either:
▪ Attribute of central point of cell (central point method), or
▪ Attribute of dominant area covering most of cell (dominant unit method).
Raster method is particularly useful for continuous phenomena & supports efficient overlay & map algebra
operations.
Raster in GIS = grid-based representation of spatial phenomena, defined by several key properties:
• Origin coordinates = Location of raster’s reference point.
• Resolution (cell size) = Determines level of detail; smaller cells capture finer detail but increase data volume.
• Dimensions = Number of columns (x-direction) & rows (y-direction).
Each raster cell holds single attribute value corresponding to specific theme or variable. To represent multiple
themes, separate raster’s are created for each attribute, producing layered structure, where each layer corresponds
to 1 thematic variable.
Important considerations:
• All rasters used for overlay or comparative analysis must share same reference frame, resolution, & dimensions.
• Raster model simplifies overlay analysis, enabling efficient combination of multiple thematic layers. This was
basis for development of map algebra, which became fundamental tool for raster-based spatial analysis since
1960s.
Creation of raster
Rasterizing error for central point (c, d) & dominant unit rasterizing (e, f)