Ver todos los 2 resúmenes de Data Visualization, escritos por Kieran Healy. Los resúmenes de Data Visualization en Stuvia están escritos por estudiantes o profesores, lo que facilita y acelera la comprensión del contenido del libro de texto. Encontrar el resumen que se adapte perfectamente a tu estilo de aprendizaje hará que estudiar sea mucho más fácil.
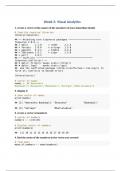
Follow the instructions in the book to create a new project. Give it a name and an author. Execute the 3 code snippets from the preface to bring all the packages into this new project then create a new R Markdown document as instructed by the book. Load the tidyverse and socviz libaries.
In order to execute code in an R Markdown object, the code must be enclosed by: ```{r}.....```
Use R studio to complete the following:
1. create a vector of the names of the members of your immediate family
...
Popular
datascience24
$10.99
Más información
Examen
Plotting_Visual_Analytics_Week4_NEC_Solved
-
-
-
19
julio 2023
2022/2023
A+
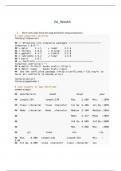
1. Show meta data from the mpg dataframe using summary().
2. Show metadata from the gapminder dataframe
3. assign ggplot(data = gapminder, mapping = aes(x = gdpPercap, y = lifeExp) to the variable 'p'
4. find the structure of the p object.
5. add () to the p object. Show p.
6. replace () with h(). Show p.
7. return to and add h(). Show p.
8. add the linear element to the h function. Show p.
9. change the x axis scare to log10. Show p.
10. try scale_y_log10(). Show p.
11. change the...
Popular
datascience24
$10.99
Más información
Resúmenes más recientes de Data Visualization
Examen
Plotting_Visual_Analytics_Week4_NEC_Solved
-
-
-
19
julio 2023
2022/2023
A+
1. Show meta data from the mpg dataframe using summary().
2. Show metadata from the gapminder dataframe
3. assign ggplot(data = gapminder, mapping = aes(x = gdpPercap, y = lifeExp) to the variable 'p'
4. find the structure of the p object.
5. add () to the p object. Show p.
6. replace () with h(). Show p.
7. return to and add h(). Show p.
8. add the linear element to the h function. Show p.
9. change the x axis scare to log10. Show p.
10. try scale_y_log10(). Show p.
11. change the...
Follow the instructions in the book to create a new project. Give it a name and an author. Execute the 3 code snippets from the preface to bring all the packages into this new project then create a new R Markdown document as instructed by the book. Load the tidyverse and socviz libaries.
In order to execute code in an R Markdown object, the code must be enclosed by: ```{r}.....```
Use R studio to complete the following:
1. create a vector of the names of the members of your immediate family
...