Corporate Finance and Behaviour
Universiteit Utrecht – ECB2FIN
Written by Lisanne Louwerse
Book summary of literature:
Brealey, Myers & Allen (2020). Principles of Corporate Finance (13th ed.). McGraw-Hill
Education.
,WEEK 1 .................................................................................................................................... 3
Preliminaries........................................................................................................................... 3
Chapter 8: Portfolio Theory and the Capital Asset Pricing Model ........................................ 4
Chapter 9: Risk and the Cost of Capital ................................................................................. 7
WEEK 2 .................................................................................................................................. 11
Chapter 13: Efficient Markets and Behavioral Finance ....................................................... 11
Chapter 17: Does debt policy matter? .................................................................................. 15
WEEK 3 .................................................................................................................................. 17
Chapter 18: How much should a corporation borrow? ........................................................ 17
WEEK 4 .................................................................................................................................. 20
Chapter 20: Understanding options ...................................................................................... 20
Chapter 21: Valuing options ................................................................................................ 23
WEEK 5 .................................................................................................................................. 27
Chapter 28: Financial analysis ............................................................................................. 27
WEEK 6 .................................................................................................................................. 36
Chapter 30: Working Capital management .......................................................................... 36
WEEK 7 .................................................................................................................................. 42
Chapter 27: Managing International Risks ........................................................................... 42
2
,Week 1
Preliminaries
▪ The risk of any stock can be broken down into 2 parts:
1) Unsystematic risk / specific risk / diversifiable risk
▪ Peculiar to that stock
2) Systematic risk / market risk
▪ Associated with market wide variations
▪ Specific risk can be eliminated by diversifying your portfolio. → All the risk of a fully
diversified portfolio is market risk.
▪ Risk premium = the difference between the return on a stock and the risk-free interest
rate (r – rf).
Investors demand a premium on their investment because they bare more risk than when
they would invest their money in e.g. Treasury bills with 0 risk.
▪ Beta = a stock’s sensitivity to market changes.
→ A security with a beta of 1.0 has average market risk. A portfolio of such securities
has the same standard deviation as the market index.
→ A security with a beta of 0.5 has below-average market risk. A portfolio of such
securities tends to move half as far as the market moves and has half the market’s
standard deviation.
𝐶𝑜𝑣(𝑠𝑡𝑜𝑐𝑘,𝑚𝑎𝑟𝑘𝑒𝑡)
▪ 𝐵𝑒𝑡𝑎 = where 𝐶𝑜𝑣(𝑠𝑡𝑜𝑐𝑘, 𝑚𝑎𝑟𝑘𝑒𝑡) = 𝜎𝑠𝑡𝑜𝑐𝑘 ∗ 𝜎𝑚𝑎𝑟𝑘𝑒𝑡 ∗ 𝜌
𝑉𝑎𝑟𝑖𝑎𝑛𝑐𝑒(𝑚𝑎𝑟𝑘𝑒𝑡)
or
𝜎𝑠𝑡𝑜𝑐𝑘
𝐵𝑒𝑡𝑎 = 𝜌 ∗ 𝑐𝑜𝑟𝑟𝑒𝑙𝑎𝑡𝑖𝑜𝑛 𝑐𝑜𝑒𝑓𝑓𝑖𝑐𝑖𝑒𝑛𝑡
𝜎𝑚𝑎𝑟𝑘𝑒𝑡
▪ Standard deviation of a portfolio = √𝑉𝑎𝑟𝑖𝑎𝑛𝑐𝑒(𝑝𝑜𝑟𝑡𝑓𝑜𝑙𝑖𝑜) =
√ 𝑤12 ∗ 𝜎12 + 𝑤22 ∗ 𝜎22 + 2 ∗ 𝑤1 ∗ 𝑤2 ∗ 𝜎1 ∗ 𝜎2 ∗ 𝜌1,2
𝑤1= proportion invested in 1
𝑤2 = proportion invested in 2
𝜎1 = standard deviation of 1
𝜎2 = standard deviation of 2
𝜌1,2 = correlation between 1 and 2
3
,Chapter 8: Portfolio Theory and the Capital Asset Pricing Model
Exercises: 1 – 6 – 12 – 16
Key terms
▪ Sharpe ratio
▪ Market risk premium
▪ Capital Asset Pricing Model (CAPM)
▪ Security Market Line
8.1 Harry Markowitz and the Birth of Portfolio Theory
If returns are normally distributed, expected return and standard deviation are the only two
measures that an investor needs to consider.
Most investors dislike uncertainty and would therefore prefer a lower standard deviation to a
higher one.
The gain from diversification depends on how highly the stocks are correlated.
ρ = +1 → Stocks move in exact lockstep.
→ No gains at all from diversification
ρ = -1 → Stocks are perfectly negatively correlated.
→ There is a combination of the two stocks that has no risk.
Efficient portfolios = portfolios that offer the highest expected return for any level of risk (=
any level of standard deviation).
Sharpe ratio = the ratio of the risk premium to the standard deviation. An efficient portfolio
offers the highest Sharpe ratio.
𝑟𝑖𝑠𝑘 𝑝𝑟𝑒𝑚𝑖𝑢𝑚 𝑟− 𝑟𝑓 r = return on portfolio
𝑆ℎ𝑎𝑟𝑝𝑒 𝑟𝑎𝑡𝑖𝑜 = = rf = risk-free interest rate
𝑠𝑡𝑎𝑛𝑑𝑎𝑟𝑑 𝑑𝑒𝑣𝑖𝑎𝑡𝑖𝑜𝑛 𝜎
8.2 The relationship between risk and return
Treasury bills have a Beta (= a stock’s sensitivity to market changes) of 0. The return is fixed,
it is unaffected by what happens to the market.
By investing in a market portfolio, investors take a higher risk than when they would invest in
Treasury bills. Therefore, they also expect a higher return. The difference between the return
on the market and the (risk-free) interest rate is the market risk premium (rm – rf).
4
, Treasury bills have a beta of 0 and a risk premium of 0. The market portfolio has a beta of 1
and a risk premium of rm – rf. But what risk premium can you expect when beta is not 0 or 1?
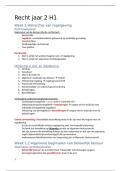
Capital Asset Pricing Model, CAPM: states that the expected risk premium on each
investment is proportional to its beta. This can be shown in a graph:
→ Each investment lies on the sloping security market line (SML). The SML can help to
determine whether an investment offers a favorable expected return compared to its
level of risk.
o If a security is above the SML, it is undervalued. Given its risk (beta), the
expected return is too high.
o If a security is below the SML, it is overvalued. Given its risk (beta), the expected
return is too low.
Since overvalued and undervalued stocks are corrected in the market, each and every stock
must lie on the security market line.
Thus, each stock offers an expected risk premium of beta times the expected market risk
premium:
𝑟 − 𝑟𝑓 = 𝛽(𝑟𝑚 − 𝑟𝑓 )
8.3 Validity and role of the Capital Asset Pricing Model
The CAPM is not the ultimate truth. There are several unsatisfactory features.
1. The actual relationship between beta and returns is not as strong as the CAPM
predicts.
2. Stocks of small companies and stocks with high book values relative to market prices,
appear to have risks not captured by the CAPM.
5
Universiteit Utrecht – ECB2FIN
Written by Lisanne Louwerse
Book summary of literature:
Brealey, Myers & Allen (2020). Principles of Corporate Finance (13th ed.). McGraw-Hill
Education.
,WEEK 1 .................................................................................................................................... 3
Preliminaries........................................................................................................................... 3
Chapter 8: Portfolio Theory and the Capital Asset Pricing Model ........................................ 4
Chapter 9: Risk and the Cost of Capital ................................................................................. 7
WEEK 2 .................................................................................................................................. 11
Chapter 13: Efficient Markets and Behavioral Finance ....................................................... 11
Chapter 17: Does debt policy matter? .................................................................................. 15
WEEK 3 .................................................................................................................................. 17
Chapter 18: How much should a corporation borrow? ........................................................ 17
WEEK 4 .................................................................................................................................. 20
Chapter 20: Understanding options ...................................................................................... 20
Chapter 21: Valuing options ................................................................................................ 23
WEEK 5 .................................................................................................................................. 27
Chapter 28: Financial analysis ............................................................................................. 27
WEEK 6 .................................................................................................................................. 36
Chapter 30: Working Capital management .......................................................................... 36
WEEK 7 .................................................................................................................................. 42
Chapter 27: Managing International Risks ........................................................................... 42
2
,Week 1
Preliminaries
▪ The risk of any stock can be broken down into 2 parts:
1) Unsystematic risk / specific risk / diversifiable risk
▪ Peculiar to that stock
2) Systematic risk / market risk
▪ Associated with market wide variations
▪ Specific risk can be eliminated by diversifying your portfolio. → All the risk of a fully
diversified portfolio is market risk.
▪ Risk premium = the difference between the return on a stock and the risk-free interest
rate (r – rf).
Investors demand a premium on their investment because they bare more risk than when
they would invest their money in e.g. Treasury bills with 0 risk.
▪ Beta = a stock’s sensitivity to market changes.
→ A security with a beta of 1.0 has average market risk. A portfolio of such securities
has the same standard deviation as the market index.
→ A security with a beta of 0.5 has below-average market risk. A portfolio of such
securities tends to move half as far as the market moves and has half the market’s
standard deviation.
𝐶𝑜𝑣(𝑠𝑡𝑜𝑐𝑘,𝑚𝑎𝑟𝑘𝑒𝑡)
▪ 𝐵𝑒𝑡𝑎 = where 𝐶𝑜𝑣(𝑠𝑡𝑜𝑐𝑘, 𝑚𝑎𝑟𝑘𝑒𝑡) = 𝜎𝑠𝑡𝑜𝑐𝑘 ∗ 𝜎𝑚𝑎𝑟𝑘𝑒𝑡 ∗ 𝜌
𝑉𝑎𝑟𝑖𝑎𝑛𝑐𝑒(𝑚𝑎𝑟𝑘𝑒𝑡)
or
𝜎𝑠𝑡𝑜𝑐𝑘
𝐵𝑒𝑡𝑎 = 𝜌 ∗ 𝑐𝑜𝑟𝑟𝑒𝑙𝑎𝑡𝑖𝑜𝑛 𝑐𝑜𝑒𝑓𝑓𝑖𝑐𝑖𝑒𝑛𝑡
𝜎𝑚𝑎𝑟𝑘𝑒𝑡
▪ Standard deviation of a portfolio = √𝑉𝑎𝑟𝑖𝑎𝑛𝑐𝑒(𝑝𝑜𝑟𝑡𝑓𝑜𝑙𝑖𝑜) =
√ 𝑤12 ∗ 𝜎12 + 𝑤22 ∗ 𝜎22 + 2 ∗ 𝑤1 ∗ 𝑤2 ∗ 𝜎1 ∗ 𝜎2 ∗ 𝜌1,2
𝑤1= proportion invested in 1
𝑤2 = proportion invested in 2
𝜎1 = standard deviation of 1
𝜎2 = standard deviation of 2
𝜌1,2 = correlation between 1 and 2
3
,Chapter 8: Portfolio Theory and the Capital Asset Pricing Model
Exercises: 1 – 6 – 12 – 16
Key terms
▪ Sharpe ratio
▪ Market risk premium
▪ Capital Asset Pricing Model (CAPM)
▪ Security Market Line
8.1 Harry Markowitz and the Birth of Portfolio Theory
If returns are normally distributed, expected return and standard deviation are the only two
measures that an investor needs to consider.
Most investors dislike uncertainty and would therefore prefer a lower standard deviation to a
higher one.
The gain from diversification depends on how highly the stocks are correlated.
ρ = +1 → Stocks move in exact lockstep.
→ No gains at all from diversification
ρ = -1 → Stocks are perfectly negatively correlated.
→ There is a combination of the two stocks that has no risk.
Efficient portfolios = portfolios that offer the highest expected return for any level of risk (=
any level of standard deviation).
Sharpe ratio = the ratio of the risk premium to the standard deviation. An efficient portfolio
offers the highest Sharpe ratio.
𝑟𝑖𝑠𝑘 𝑝𝑟𝑒𝑚𝑖𝑢𝑚 𝑟− 𝑟𝑓 r = return on portfolio
𝑆ℎ𝑎𝑟𝑝𝑒 𝑟𝑎𝑡𝑖𝑜 = = rf = risk-free interest rate
𝑠𝑡𝑎𝑛𝑑𝑎𝑟𝑑 𝑑𝑒𝑣𝑖𝑎𝑡𝑖𝑜𝑛 𝜎
8.2 The relationship between risk and return
Treasury bills have a Beta (= a stock’s sensitivity to market changes) of 0. The return is fixed,
it is unaffected by what happens to the market.
By investing in a market portfolio, investors take a higher risk than when they would invest in
Treasury bills. Therefore, they also expect a higher return. The difference between the return
on the market and the (risk-free) interest rate is the market risk premium (rm – rf).
4
, Treasury bills have a beta of 0 and a risk premium of 0. The market portfolio has a beta of 1
and a risk premium of rm – rf. But what risk premium can you expect when beta is not 0 or 1?
Capital Asset Pricing Model, CAPM: states that the expected risk premium on each
investment is proportional to its beta. This can be shown in a graph:
→ Each investment lies on the sloping security market line (SML). The SML can help to
determine whether an investment offers a favorable expected return compared to its
level of risk.
o If a security is above the SML, it is undervalued. Given its risk (beta), the
expected return is too high.
o If a security is below the SML, it is overvalued. Given its risk (beta), the expected
return is too low.
Since overvalued and undervalued stocks are corrected in the market, each and every stock
must lie on the security market line.
Thus, each stock offers an expected risk premium of beta times the expected market risk
premium:
𝑟 − 𝑟𝑓 = 𝛽(𝑟𝑚 − 𝑟𝑓 )
8.3 Validity and role of the Capital Asset Pricing Model
The CAPM is not the ultimate truth. There are several unsatisfactory features.
1. The actual relationship between beta and returns is not as strong as the CAPM
predicts.
2. Stocks of small companies and stocks with high book values relative to market prices,
appear to have risks not captured by the CAPM.
5