Examen
MATH 533 WEEK 7 COURSE PROJECT PART C, REGRESSION AND CORRELATION
- Grado
- Institución
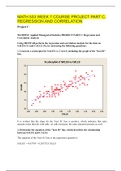
Using Minitab, perform the regression and correlation analysis for the data on SALES (Y) and CALLS (X) by answering the following questions. Generate a scatterplot for SALES versus CALLS, including the graph of the best fit line. Interpret. Determine the equation of the best fit line, which descri...
[Mostrar más]