Introduction:
In this assignment, I will be talking about the findings that I have gathered
and effectively communicating the insights to be able to guide strategic
decisions.
Presentation of findings:
Method 1: Histograms
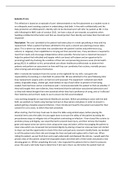
A histogram is graph that is used to display the distribution of any
numerical data by putting it all in groups and making them into ranges
Age Group No of
respondents
10-12 12
13-17 15
18-20 11
21+ 12
, and showing the frequency of the values presented.
This Picture shows how many respondents are from each age group. For
example, 12 of the respondents are between the ages of 10-12 years of
age, and 15 respondents are from the ages of 13-17 years of age.
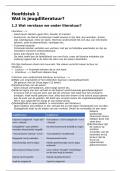
Gender Number of
respondents
Male 22
Female 28
This picture shows us how many of the respondents are either male or
female, where we can see from the graph that there were more female
that answered the questionnaire rather than men.
1
In this assignment, I will be talking about the findings that I have gathered
and effectively communicating the insights to be able to guide strategic
decisions.
Presentation of findings:
Method 1: Histograms
A histogram is graph that is used to display the distribution of any
numerical data by putting it all in groups and making them into ranges
Age Group No of
respondents
10-12 12
13-17 15
18-20 11
21+ 12
, and showing the frequency of the values presented.
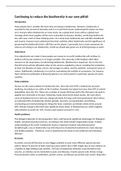
This Picture shows how many respondents are from each age group. For
example, 12 of the respondents are between the ages of 10-12 years of
age, and 15 respondents are from the ages of 13-17 years of age.
Gender Number of
respondents
Male 22
Female 28
This picture shows us how many of the respondents are either male or
female, where we can see from the graph that there were more female
that answered the questionnaire rather than men.
1