NOTES epidemiology (Epi)
Revision: continuous data
T-test
You can use a t-test when we have a continuous outcome, we might be interested in several
questions:
- Does the mean value of our outcome differ from a pre-specified value?
o Requires a one-sample t-test. It test the null-hypothesis that the mean value in
our sample is equal to a pre-specified value.
- Do the mean values of two independent groups differ?
o Requires an independent two-sample t-test. This means that the two groups
that are being compared are independent of each other. In other words, they
contain different participants and are assumed to be sampled from different
populations.
- Does the mean difference between two measurement in the same population differ
from a pre-specified value?
o Deals with two groups that are not independent. Think of a measurement
before an intervention and after an intervention in the same participants. This
requires the use of a paired t-test (dependent samples t-test). You can think of
this test as a one-sample t-test applied to the differences between two
measurements in the same participant.
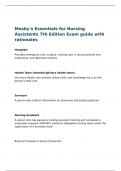
ANOVA
= to compare a continuous dependent variable between three or more categorical groups in
the independent variable/ a statistical tool applied to unrelated groups to determine whether
they have a common meaning.
The difference in means between two groups/populations can also be analyzed using analysis
of variance (ANOVA) or linear regression analysis. In addition, these models also allow for
categorical variables with more than two categories.
In analysis of variance, the difference between the means of several groups and the overall
mean (variance between groups) is compared to the differences between the values within a
group and the group means (variance within groups). The former can be seen as the signal,
the latter as the noise. When the signal is stronger than the noise, the test will show a
significant difference between the mean of one or more of the groups and the overall mean.
Formally, this is assessed through the F-test, which answers the question if any of the group
means is statistically significant different form the overall mean. The disadvantage of ANOVA
is that it is mostly aimed at testing, and it does not say anything of how strong the differences
are.
- Predict a continuous outcome (response variable) on the basis of one or more
categorical inputs (predicter variable).
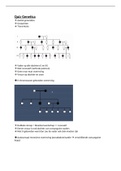
,Linear regression
= Primally a means to answer questions about the magnitude and direction of association
between to quantitative variables.
Linear regression enables the estimation of relations between a continuous independent and
a continuous outcome variable.
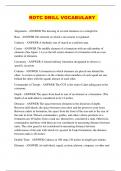
Linear regression is based on the notion that we fit the best fitting regression line for the
relation between an independent and a continuous outcome variable.
- outcome = b0 + b1 * independent var + error
o BMI (dependent) = a + b * sugar intake (independent) + error;
▪ a = average y at x=0 (intercept) – a = ȳ (mean BMI) - b * x̄ (mean sugar)
▪ b = expected change in in y as a function of one unit change in x =
regression coefficient or slope of the line.
• Σ(xi - x̄)(yi - ȳ)/ Σ(xi - x̄)2
- Predict a continuous outcome on the basis of one or more continuous predictor
variables.
X Assumptions:
- There has to be a linear relationship between the independent and the dependent
variables.
- Homogeneity of variance.
- Normally distributed residuals.
- Independent observations.
ANOVA vs linear regression
- ANOVA: do the means of group A, group B, group C differ?
- Regression: do changes in Variable X influence changes in Outcome Y?
, LECTURE 1.1: study design
- Identify different types of study design used in epidemiology.
- Describe the main strengths and weaknesses of the different designs.
- Apply these strengths and weaknesses to choose an appropriate study design fitting a
research question.
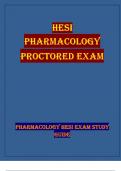
PART 1: classification study designs
- A characteristic of an experimental study design is that researchers have full control
over their study groups. The researchers assign people themselves to either the
control or the experimental group.
o Random allocation, like flipping a coin = RCT.
o No random allocation = non-RCT.
- With observational studies, researchers cannot control their study groups. The
different groups are already divided at the beginning.
o When there is a distinct control group and experimental group in such a way
that they can be compared to each other = analytical study.
o When there is no control group = descriptive study.
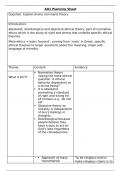
X types of study designs:
- Case report
- Cross sectional study
- Case control study
- Cohort study
- Randomized control trial
- Meta analysis
→ the strength of evidence goes down for every study design; highest strength of evidence in
the case report studies and lowest strength of evidence in the meta-analysis. However,
different study designs serve different purposes. Therefore, a study is only as good as good as
the chosen study design. When you have a certain type of data, usually only one study design
fits that data the best -> otherwise you will have a poorly designed study.
Revision: continuous data
T-test
You can use a t-test when we have a continuous outcome, we might be interested in several
questions:
- Does the mean value of our outcome differ from a pre-specified value?
o Requires a one-sample t-test. It test the null-hypothesis that the mean value in
our sample is equal to a pre-specified value.
- Do the mean values of two independent groups differ?
o Requires an independent two-sample t-test. This means that the two groups
that are being compared are independent of each other. In other words, they
contain different participants and are assumed to be sampled from different
populations.
- Does the mean difference between two measurement in the same population differ
from a pre-specified value?
o Deals with two groups that are not independent. Think of a measurement
before an intervention and after an intervention in the same participants. This
requires the use of a paired t-test (dependent samples t-test). You can think of
this test as a one-sample t-test applied to the differences between two
measurements in the same participant.
ANOVA
= to compare a continuous dependent variable between three or more categorical groups in
the independent variable/ a statistical tool applied to unrelated groups to determine whether
they have a common meaning.
The difference in means between two groups/populations can also be analyzed using analysis
of variance (ANOVA) or linear regression analysis. In addition, these models also allow for
categorical variables with more than two categories.
In analysis of variance, the difference between the means of several groups and the overall
mean (variance between groups) is compared to the differences between the values within a
group and the group means (variance within groups). The former can be seen as the signal,
the latter as the noise. When the signal is stronger than the noise, the test will show a
significant difference between the mean of one or more of the groups and the overall mean.
Formally, this is assessed through the F-test, which answers the question if any of the group
means is statistically significant different form the overall mean. The disadvantage of ANOVA
is that it is mostly aimed at testing, and it does not say anything of how strong the differences
are.
- Predict a continuous outcome (response variable) on the basis of one or more
categorical inputs (predicter variable).
,Linear regression
= Primally a means to answer questions about the magnitude and direction of association
between to quantitative variables.
Linear regression enables the estimation of relations between a continuous independent and
a continuous outcome variable.
Linear regression is based on the notion that we fit the best fitting regression line for the
relation between an independent and a continuous outcome variable.
- outcome = b0 + b1 * independent var + error
o BMI (dependent) = a + b * sugar intake (independent) + error;
▪ a = average y at x=0 (intercept) – a = ȳ (mean BMI) - b * x̄ (mean sugar)
▪ b = expected change in in y as a function of one unit change in x =
regression coefficient or slope of the line.
• Σ(xi - x̄)(yi - ȳ)/ Σ(xi - x̄)2
- Predict a continuous outcome on the basis of one or more continuous predictor
variables.
X Assumptions:
- There has to be a linear relationship between the independent and the dependent
variables.
- Homogeneity of variance.
- Normally distributed residuals.
- Independent observations.
ANOVA vs linear regression
- ANOVA: do the means of group A, group B, group C differ?
- Regression: do changes in Variable X influence changes in Outcome Y?
, LECTURE 1.1: study design
- Identify different types of study design used in epidemiology.
- Describe the main strengths and weaknesses of the different designs.
- Apply these strengths and weaknesses to choose an appropriate study design fitting a
research question.
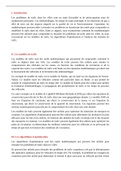
PART 1: classification study designs
- A characteristic of an experimental study design is that researchers have full control
over their study groups. The researchers assign people themselves to either the
control or the experimental group.
o Random allocation, like flipping a coin = RCT.
o No random allocation = non-RCT.
- With observational studies, researchers cannot control their study groups. The
different groups are already divided at the beginning.
o When there is a distinct control group and experimental group in such a way
that they can be compared to each other = analytical study.
o When there is no control group = descriptive study.
X types of study designs:
- Case report
- Cross sectional study
- Case control study
- Cohort study
- Randomized control trial
- Meta analysis
→ the strength of evidence goes down for every study design; highest strength of evidence in
the case report studies and lowest strength of evidence in the meta-analysis. However,
different study designs serve different purposes. Therefore, a study is only as good as good as
the chosen study design. When you have a certain type of data, usually only one study design
fits that data the best -> otherwise you will have a poorly designed study.