Constructing Scatterplots Quiz
How many variables are displayed in a scatterplot?
one along the x-axis, and one along the y-axis
one along the x-axis, and two along the y-axis
two along the x-axis, and one along the y-axis
two along the x-axis, and two along the y-axis - answerA.one along the x-axis, and one
along the y-axis
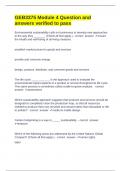
An online store sold a gift basket at five different prices and recorded the number of gift
baskets that were sold at each price. The results are shown in the scatterplot.Which
statement is correct based on the scatterplot?
There is no relationship between price and gift baskets sold because the points do not
form a straight line.
There is no relationship between price and gift baskets sold because there are multiple
prices at which 80 gift baskets were sold.
There is a relationship between price and gift baskets sold, and the relationship is that
as the price increases, the gift baskets sold increases.
There is a relationship between price and gift baskets sold, and the relationship is that
as the price increases, the gift baskets sold decreases. - answerD.There is a
relationship between price and gift baskets sold, and the relationship is that as the price
increases, the gift baskets sold decreases.
Which describes a correct way to construct a scatterplot?
When analyzing the number of junk e-mails received each day of the week, the number
of junk e-mails is the independent variable.
When analyzing the number of cups of hot tea that are sold during days with varying
average temperatures, temperature is the dependent variable.
When analyzing shoe size according to height, shoe size is the independent variable.
When analyzing the number of boys who participate in volleyball each year for several
years, the number of boys is the dependent variable. - answerB.When analyzing the
number of cups of hot tea that are sold during days with varying average temperatures,
temperature is the dependent variable.
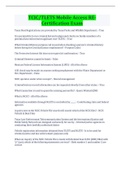
How many points should be plotted when creating a scatterplot from the table of values
below?
5
6
11
12 - answerB.6
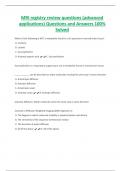
Which scatterplot correctly represents the table of values below? - answerC
How many variables are displayed in a scatterplot?
one along the x-axis, and one along the y-axis
one along the x-axis, and two along the y-axis
two along the x-axis, and one along the y-axis
two along the x-axis, and two along the y-axis - answerA.one along the x-axis, and one
along the y-axis
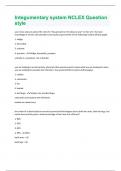
An online store sold a gift basket at five different prices and recorded the number of gift
baskets that were sold at each price. The results are shown in the scatterplot.Which
statement is correct based on the scatterplot?
There is no relationship between price and gift baskets sold because the points do not
form a straight line.
There is no relationship between price and gift baskets sold because there are multiple
prices at which 80 gift baskets were sold.
There is a relationship between price and gift baskets sold, and the relationship is that
as the price increases, the gift baskets sold increases.
There is a relationship between price and gift baskets sold, and the relationship is that
as the price increases, the gift baskets sold decreases. - answerD.There is a
relationship between price and gift baskets sold, and the relationship is that as the price
increases, the gift baskets sold decreases.
Which describes a correct way to construct a scatterplot?
When analyzing the number of junk e-mails received each day of the week, the number
of junk e-mails is the independent variable.
When analyzing the number of cups of hot tea that are sold during days with varying
average temperatures, temperature is the dependent variable.
When analyzing shoe size according to height, shoe size is the independent variable.
When analyzing the number of boys who participate in volleyball each year for several
years, the number of boys is the dependent variable. - answerB.When analyzing the
number of cups of hot tea that are sold during days with varying average temperatures,
temperature is the dependent variable.
How many points should be plotted when creating a scatterplot from the table of values
below?
5
6
11
12 - answerB.6
Which scatterplot correctly represents the table of values below? - answerC