ARMS
COLLEGE 1
DIFFERENCES BETWEEN FREQUENTIST AND BAYESIAN
. Frequentist framework:
- Test how well the data fit H0 (NHST)
- P-values, confidence intervals, effect sizes, power analysis.
. Bayesian framework:
- Probability of the hypothesis given the data, taking prior information into account
- Bayes factors, priors, posteriors, credible intervals
Estimate something
. Frequentist= Likelihood function= the joint probability (or probability density) of
observed data viewed as a function of the parameters of a statistical model.
. Bayesian= likelihood function + prior information about u: posterior distribution for u.
- Advantage accumulating knowledge
- Disadvantage results depend on choice of prior (hoe specifieker de prior hoe
specifieker de posterior) (hoe groter de data hoe meer invloed op de posterior).
Posterior distribution mean, mode, SD, 95%credible interval
Lady tasting tea= results and conclusion depend on things not observed and on the sampling
plan, same data can give different results.
Testing hypothesis
. Bayesian: calculate the probability of the hypothesis given the data
PMP= posterior model probability, the probability of the hypothesis after observing the
data.
2 criteria
1. How sensible is the probability, based on prior knowledge (prior)
2. How well it fits the new evidence (data)
Comparative testing: hypotheses are tested against one another bayes factor (<1 is meer
support voor H0, >1 is meer support voor H1)
Probability=
. Frequentist: is the relative frequency of events
. Bayesian: is the degree or belief
. Frequentist 95% confidence interval= if we were to repeat this experiment many times
and calculate each time 95% of the intervals will include the true parameter value.
. Bayesian 95% credible interval= there is 95% probability that the true value is in the
credible interval
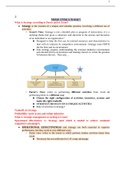
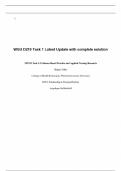
, Linear regression: capture a relationship between two variables. (Scatterplot, x and y
values, positive of negative association)
Yhead
Yi= B0+ B1x1i + ei
Multiple linear regression: 2 predictors values, 1 outcome variable
Yi= B0+ B1x1i + B2x2i + ei
B0 intercept
B1 slope of X1
B2 slope of X2
E residual (residuen zijn gelijk van de geordend boven en onder de lijn, even ver van de
lijn af, punten liggen om de lijn heen ei~N(0;sigmae)
Assumptie multiple regression:
1. Ratio/ interval variables nominal variables can be turned into dummy variables
who has 0 and 1.
2. Dependent variable is continuous
3. Linear relation
4. No outliers
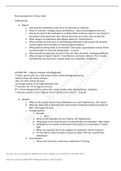
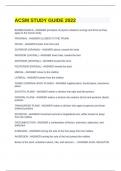
. Frequentist analysis:
Linear regression tabel:
R2= hoeveel variatie wordt veroorzaakt door het model in de steekproef
R= correlatie tussen de y (afhankelijke variabele) en model
Adjusted R2= hoeveel variantie kan het model verklaren buiten de steekproef (populatie). Is
afhankelijk van hoe groot de steekproef is: Als je een kleine steekproef hebt dan is het
moeilijker om iets te voorspellen in de populatie. En afhankelijk van hoeveelheid variabelen.
Anova tabel:
Test voor R2 is R2 significant groter dan 0, om Ho te verwerpen
F=
P= p-waarde, significantieniveau
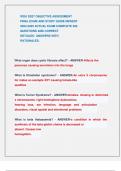
Coefficients tabel:
Unstandardized= B0/intercept, B1, B2. 1x gaat y zoveel omhoog of omlaag. Je kan de
coëfficiënten niet vergelijken om te kijken welke variabele meer invloed heeft, want ze zijn
op verschillende schalen.
Standard error=
Standardized= welke variabelen heeft de grootste invloed? Hierbij zijn alle variabelen op
dezelfde schaal gezet en dus vergelijkbaar. Kijk naar het hoogste cijfer (zowel – als +)
P= is het significant?
COLLEGE 1
DIFFERENCES BETWEEN FREQUENTIST AND BAYESIAN
. Frequentist framework:
- Test how well the data fit H0 (NHST)
- P-values, confidence intervals, effect sizes, power analysis.
. Bayesian framework:
- Probability of the hypothesis given the data, taking prior information into account
- Bayes factors, priors, posteriors, credible intervals
Estimate something
. Frequentist= Likelihood function= the joint probability (or probability density) of
observed data viewed as a function of the parameters of a statistical model.
. Bayesian= likelihood function + prior information about u: posterior distribution for u.
- Advantage accumulating knowledge
- Disadvantage results depend on choice of prior (hoe specifieker de prior hoe
specifieker de posterior) (hoe groter de data hoe meer invloed op de posterior).
Posterior distribution mean, mode, SD, 95%credible interval
Lady tasting tea= results and conclusion depend on things not observed and on the sampling
plan, same data can give different results.
Testing hypothesis
. Bayesian: calculate the probability of the hypothesis given the data
PMP= posterior model probability, the probability of the hypothesis after observing the
data.
2 criteria
1. How sensible is the probability, based on prior knowledge (prior)
2. How well it fits the new evidence (data)
Comparative testing: hypotheses are tested against one another bayes factor (<1 is meer
support voor H0, >1 is meer support voor H1)
Probability=
. Frequentist: is the relative frequency of events
. Bayesian: is the degree or belief
. Frequentist 95% confidence interval= if we were to repeat this experiment many times
and calculate each time 95% of the intervals will include the true parameter value.
. Bayesian 95% credible interval= there is 95% probability that the true value is in the
credible interval
, Linear regression: capture a relationship between two variables. (Scatterplot, x and y
values, positive of negative association)
Yhead
Yi= B0+ B1x1i + ei
Multiple linear regression: 2 predictors values, 1 outcome variable
Yi= B0+ B1x1i + B2x2i + ei
B0 intercept
B1 slope of X1
B2 slope of X2
E residual (residuen zijn gelijk van de geordend boven en onder de lijn, even ver van de
lijn af, punten liggen om de lijn heen ei~N(0;sigmae)
Assumptie multiple regression:
1. Ratio/ interval variables nominal variables can be turned into dummy variables
who has 0 and 1.
2. Dependent variable is continuous
3. Linear relation
4. No outliers
. Frequentist analysis:
Linear regression tabel:
R2= hoeveel variatie wordt veroorzaakt door het model in de steekproef
R= correlatie tussen de y (afhankelijke variabele) en model
Adjusted R2= hoeveel variantie kan het model verklaren buiten de steekproef (populatie). Is
afhankelijk van hoe groot de steekproef is: Als je een kleine steekproef hebt dan is het
moeilijker om iets te voorspellen in de populatie. En afhankelijk van hoeveelheid variabelen.
Anova tabel:
Test voor R2 is R2 significant groter dan 0, om Ho te verwerpen
F=
P= p-waarde, significantieniveau
Coefficients tabel:
Unstandardized= B0/intercept, B1, B2. 1x gaat y zoveel omhoog of omlaag. Je kan de
coëfficiënten niet vergelijken om te kijken welke variabele meer invloed heeft, want ze zijn
op verschillende schalen.
Standard error=
Standardized= welke variabelen heeft de grootste invloed? Hierbij zijn alle variabelen op
dezelfde schaal gezet en dus vergelijkbaar. Kijk naar het hoogste cijfer (zowel – als +)
P= is het significant?