In this document, you will find the recap of chapter 5 to 15 from the book used in Methodology 3:
Genes, Brain, and Behaviour. These chapters are the obligatory chapters needed for the exam. This
document is one of the two documents provided for this course, the other being the lectures. If you
find any mistakes, please notify me and I will improve them immediately. I wish you the best for
studying and for the exam.
,Content
A.Correlation in data...............................................................................................................................3
B.The probability of p..............................................................................................................................4
C.Comparisons........................................................................................................................................5
D.Correlations II......................................................................................................................................8
E.Experimental designs.........................................................................................................................10
F.Statistical significance........................................................................................................................11
G.Multiple groups.................................................................................................................................13
H.Comparisons with multiple independent variables...........................................................................14
I.ANOVA................................................................................................................................................15
J.Multiple Regression Analysis..............................................................................................................16
, A. Correlation in data
Background on correlation
A correlation is a relationship between two variables of interest: so, for example, there
is a correlation between shoe size and length: the bigger someone’s shoe size, the larger
someone is. Other variables, such as conservatism or progressivism can be measured
and correlated to other variables as well.
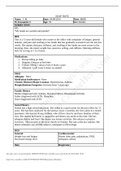
Visuals
Correlation can be shown in different ways. Right winged Left winged
Level of education and right or left winged No education 89 13
orientation can be put into a cross tab as University 6 85
Table 1: a crosstab
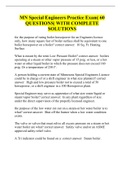
shown in table 1. Next, correlations, for
example for shoe size and length, can be
shown in a scatter plot. An example of a
scatterplot is shown in figure 1. As you can see
in both graphs, there is a strong correlation
between respectively education and political
view and between shoe size and education. For
shoe size and length, a higher length correlates
positively with a larger shoe size. If shoe size Figure 1: a scatterplot
was, hypothetically, correlated with a shorter
person, there would be a negative correlation.
In a scatter plot, four lines can be drawn to divide the scatter plot into four segments: a
horizontal line through the middle and a vertical line through the middle. The segments
below left and upper right are according to the trend that people generally have a larger
shoe size when they are taller themselves. However, an almost perfect correlation like
the one in figure 1 is not very common: usually, more people fall into the other
segments: upper left and below right.
Causation in correlation
Correlation is an often used test to look for consistency between two variables.
However, this does not mean that there is a causation in the data. A causation means
that one variable (say, shoe size) causes the other (say, length). Causation cannot be
inferred from correlations: other underlying variables may lead to both a larger shoe size
and a higher length.
Genes, Brain, and Behaviour. These chapters are the obligatory chapters needed for the exam. This
document is one of the two documents provided for this course, the other being the lectures. If you
find any mistakes, please notify me and I will improve them immediately. I wish you the best for
studying and for the exam.
,Content
A.Correlation in data...............................................................................................................................3
B.The probability of p..............................................................................................................................4
C.Comparisons........................................................................................................................................5
D.Correlations II......................................................................................................................................8
E.Experimental designs.........................................................................................................................10
F.Statistical significance........................................................................................................................11
G.Multiple groups.................................................................................................................................13
H.Comparisons with multiple independent variables...........................................................................14
I.ANOVA................................................................................................................................................15
J.Multiple Regression Analysis..............................................................................................................16
, A. Correlation in data
Background on correlation
A correlation is a relationship between two variables of interest: so, for example, there
is a correlation between shoe size and length: the bigger someone’s shoe size, the larger
someone is. Other variables, such as conservatism or progressivism can be measured
and correlated to other variables as well.
Visuals
Correlation can be shown in different ways. Right winged Left winged
Level of education and right or left winged No education 89 13
orientation can be put into a cross tab as University 6 85
Table 1: a crosstab
shown in table 1. Next, correlations, for
example for shoe size and length, can be
shown in a scatter plot. An example of a
scatterplot is shown in figure 1. As you can see
in both graphs, there is a strong correlation
between respectively education and political
view and between shoe size and education. For
shoe size and length, a higher length correlates
positively with a larger shoe size. If shoe size Figure 1: a scatterplot
was, hypothetically, correlated with a shorter
person, there would be a negative correlation.
In a scatter plot, four lines can be drawn to divide the scatter plot into four segments: a
horizontal line through the middle and a vertical line through the middle. The segments
below left and upper right are according to the trend that people generally have a larger
shoe size when they are taller themselves. However, an almost perfect correlation like
the one in figure 1 is not very common: usually, more people fall into the other
segments: upper left and below right.
Causation in correlation
Correlation is an often used test to look for consistency between two variables.
However, this does not mean that there is a causation in the data. A causation means
that one variable (say, shoe size) causes the other (say, length). Causation cannot be
inferred from correlations: other underlying variables may lead to both a larger shoe size
and a higher length.