Financial Analysis
with Microsoft
Excel, 9e Timothy
Mayes
(Solutions Manual All Chapter)
(For Complete File Download link at the end of
this File)
, Tesla Inc.
DATE CLOSE Return Cum. Return
2014 223.57
2015 265.41 18.71% 18.71% 400.00
2016 229.51 -13.53% 2.66% 300.00
2017 343.85 49.82% 53.80% 200.00
2018 306.65 -10.82% 37.16%
100.00
2019 228.04 -25.64% 2.00%
-
Total Return 2.00% 2.00% 2.00%
Compound Annual Return 0.40% 0.40% 0.40%
This is Excel files solutions manual, PDF is converted only for a short review, d) The two charts
line chart are aligned in the cente
complete solutions manual is in excel files.
The reason for this is that the lab
ignore this PDF bad formatting, when you will download excel files, are numbers, the XY Scatter char
make a great deal of difference. O
it will be perfect and complete solutions manual in excel. is that a Line chart was used whe
showing relationships in numeric
One possible alternative chart
400.00
200.00
e) The above chart is a 3D Line ch
has a marble backround
any practical purpose, and actual
to understand. This is an example
visualization experts recommend
charts above.
, Tesla Inc. (line chart) Tesla Inc. (XY Scatter Chart)
Tesla Inc. Tesla Inc.
(line chart) (XY Scatter Chart)
400.00
300.00
200.00
100.00
CLOSE
-
2014 2015 2016 2017 2018 2019
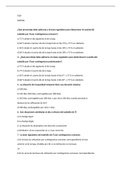
The two charts are created above. They appear to be very similar, but a close look will reveal a key difference. Notice that the da
line chart are aligned in the center of the X-axis label. In the XY chart they are aligned directly above the data point on the
The reason for this is that the label on the line chart is just that, a label. Excel doesn't treat it as a number and it migh
are numbers, the XY Scatter chart is slightly more appropriate in this case. However, it doesn't matter too much here. In oth
make a great deal of difference. One of the most common questions that I get is "Why doesn't my chart display properly?" In m
is that a Line chart was used when a Scatter chart was the correct choice. Remember, Line charts are for categorical data and
showing relationships in numerical data.
One possible alternative chart
Tesla Inc.
400.00
200.00
- CLOSE
CLOSE
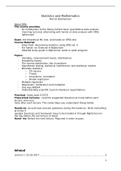
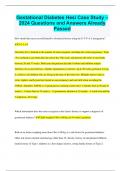
The above chart is a 3D Line chart that has been slightly rotated and
has a marble backround added. Note that the "eye candy" doesn't serve
any practical purpose, and actually makes the data slightly more difficult
to understand. This is an example of the type of chart that data
visualization experts recommend against. Much better are the simple
charts above.
with Microsoft
Excel, 9e Timothy
Mayes
(Solutions Manual All Chapter)
(For Complete File Download link at the end of
this File)
, Tesla Inc.
DATE CLOSE Return Cum. Return
2014 223.57
2015 265.41 18.71% 18.71% 400.00
2016 229.51 -13.53% 2.66% 300.00
2017 343.85 49.82% 53.80% 200.00
2018 306.65 -10.82% 37.16%
100.00
2019 228.04 -25.64% 2.00%
-
Total Return 2.00% 2.00% 2.00%
Compound Annual Return 0.40% 0.40% 0.40%
This is Excel files solutions manual, PDF is converted only for a short review, d) The two charts
line chart are aligned in the cente
complete solutions manual is in excel files.
The reason for this is that the lab
ignore this PDF bad formatting, when you will download excel files, are numbers, the XY Scatter char
make a great deal of difference. O
it will be perfect and complete solutions manual in excel. is that a Line chart was used whe
showing relationships in numeric
One possible alternative chart
400.00
200.00
e) The above chart is a 3D Line ch
has a marble backround
any practical purpose, and actual
to understand. This is an example
visualization experts recommend
charts above.
, Tesla Inc. (line chart) Tesla Inc. (XY Scatter Chart)
Tesla Inc. Tesla Inc.
(line chart) (XY Scatter Chart)
400.00
300.00
200.00
100.00
CLOSE
-
2014 2015 2016 2017 2018 2019
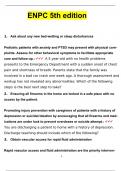
The two charts are created above. They appear to be very similar, but a close look will reveal a key difference. Notice that the da
line chart are aligned in the center of the X-axis label. In the XY chart they are aligned directly above the data point on the
The reason for this is that the label on the line chart is just that, a label. Excel doesn't treat it as a number and it migh
are numbers, the XY Scatter chart is slightly more appropriate in this case. However, it doesn't matter too much here. In oth
make a great deal of difference. One of the most common questions that I get is "Why doesn't my chart display properly?" In m
is that a Line chart was used when a Scatter chart was the correct choice. Remember, Line charts are for categorical data and
showing relationships in numerical data.
One possible alternative chart
Tesla Inc.
400.00
200.00
- CLOSE
CLOSE
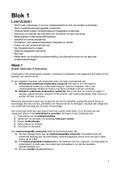
The above chart is a 3D Line chart that has been slightly rotated and
has a marble backround added. Note that the "eye candy" doesn't serve
any practical purpose, and actually makes the data slightly more difficult
to understand. This is an example of the type of chart that data
visualization experts recommend against. Much better are the simple
charts above.