Research Methods in Communication Science
Vrije Universiteit – 2022/2023 – S_RMCS
Table of content
LECTURE 1 – INTRODUCTION AND LINEAR REGRESSION 2
LECTURE 2 – MULTIPLE REGRESSION 8
LECTURE 3 – REGRESSION WITH CATEGORICAL PREDICTORS 17
LECTURE 4 – REGRESSION ASSUMPTIONS 23
LECTURE 5 – HOW DO WE APPROACH CAUSALITY? 35
LECTURE 6 – MEDIATION 41
LECTURE 7 – MODERATION AND INTERACTION 47
LECTURE 8 – MODERATION WITH PROCESS 57
LECTURE 9 – REPEATED MEASURES ANOVA 63
LECTURE 10 – MIXED DESIGNS ANOVA 73
LECTURE 11 – MANOVA 82
LECTURE 12 – DISCRIMINANT ANALYSIS 91
1
,Lecture 1 – Introduction and linear regression
Harlington & Hayes – chapter 2
Regression: what you know
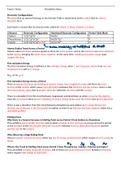
Regression equation: Wage=7.187 + 0.193*age
Constant 𝑎 = 7.187: expected wage if age =0
Coefficient 𝑏age=0.193: if age increases with 1 year, wage increases with 0.193 units
- Rate of change
Significance t=21.498, P<0.001. 𝑏age is statistically significant...
- B is relationship between age and wage is sample, not population. That’s why you look at the t-test
Standardized coefficient Betaage: if age increases with 1 sd, wage increases with 0.247 sd’s
- Beta independent of measuring unit!
‘Expected’ and ‘predicted’ is the same in regression
In statistics, standardized [regression] coefficients, also called beta coefficients or beta weights, are the
estimates resulting from a regression analysis that have been standardized so that the variances of
dependent and independent variables are 1. Therefore, standardized coefficients refer to how many
standard deviations a dependent variable will change, per standard deviation increase in the predictor
variable. For simple linear regression, the absolute value of the unstandardized regression coefficient
equals the correlation between the independent and dependent variables.
Standardization of the coefficient is usually done to answer the question of which of the independent
variables have a greater effect on the dependent variable in a multiple regression analysis, when the
variables are measured in different units of measurement (for example, income measured in dollars and
family size measured in number of individuals).
Interpretation of regression coefficients
Y= a + b * X → linear regression line
Constant/b0 or a: value of if X = 0. Intuitive meaning?
- Expected wage if experience = 0
- Expected weight if length = 0...
b0 has an intuitive interpretation...
- if X=0 is a plausible situation
Be careful with data extrapolation!
We typically mean-center
- deduct the mean from every value
- we’ll see it again!
Then, constant: value of of X = the mean of X!
2
,Slope: difference in if X increases with one unit
- The expected ‘rate of change’ in Y
o What the regression says will happen → expected! Not the truth
What happens when we standardize both X and Y?
- has mean = 0, standard deviation = 1
Interpretation of standardized coefficient (beta): if X goes up with one standard deviation, then Y increases
by beta standard deviations
With standardization, the constant is always 0
-
- So, the regression equation becomes:
If there are beta’s, there is no a
Standardized and unstandardised
In bivariate regression the beta is equal to the correlation coefficient differ from
each other:
- b1 depends on the measurement unit. 𝑟xy doesn’t!
- 𝑟xy depends on the range of the variable. b1 doesn’t!
- 𝑟xy goes down if there is a third variable Z that affects Y but is not correlated with X. b1 doesn’t!
That's why we use 𝑏1 and 𝑟xy in other occasions:
- b1 is a better measure of the effect of X on Y
- 𝑟xy/beta is a better measure of predictive power, relative importance and statistical significance
o How strong is a relationship
Let’s focus on residuals
You have heard smth on them...
3
, Difference reality – regression line: residual
But then what does mean? A ‘Model’
- Model = an approximation of reality
The price you pay for simplicity
How does this model work
- Association between an independent (𝑌) and a dependent variable (𝑋)
- With a line instead of a scatterplot
But which line is correct?
- Or else: which line approximates best reality?
- Or else: which line explains best the association between Y and X?
- Or else: which values of 𝑏0 and 𝑏1 ‘fit’ best our data?
Solution: least squares method
Specifically: reduce error. Error = residual
- Make residuals as low as possible!
Reduce the sum ?
- There are positive and negative ones
- But cancel each other out...
So, we add a square: 2
- If you square it, it will never be negative
Aim of regression: find b0 and b1 that minimize 2
4
Vrije Universiteit – 2022/2023 – S_RMCS
Table of content
LECTURE 1 – INTRODUCTION AND LINEAR REGRESSION 2
LECTURE 2 – MULTIPLE REGRESSION 8
LECTURE 3 – REGRESSION WITH CATEGORICAL PREDICTORS 17
LECTURE 4 – REGRESSION ASSUMPTIONS 23
LECTURE 5 – HOW DO WE APPROACH CAUSALITY? 35
LECTURE 6 – MEDIATION 41
LECTURE 7 – MODERATION AND INTERACTION 47
LECTURE 8 – MODERATION WITH PROCESS 57
LECTURE 9 – REPEATED MEASURES ANOVA 63
LECTURE 10 – MIXED DESIGNS ANOVA 73
LECTURE 11 – MANOVA 82
LECTURE 12 – DISCRIMINANT ANALYSIS 91
1
,Lecture 1 – Introduction and linear regression
Harlington & Hayes – chapter 2
Regression: what you know
Regression equation: Wage=7.187 + 0.193*age
Constant 𝑎 = 7.187: expected wage if age =0
Coefficient 𝑏age=0.193: if age increases with 1 year, wage increases with 0.193 units
- Rate of change
Significance t=21.498, P<0.001. 𝑏age is statistically significant...
- B is relationship between age and wage is sample, not population. That’s why you look at the t-test
Standardized coefficient Betaage: if age increases with 1 sd, wage increases with 0.247 sd’s
- Beta independent of measuring unit!
‘Expected’ and ‘predicted’ is the same in regression
In statistics, standardized [regression] coefficients, also called beta coefficients or beta weights, are the
estimates resulting from a regression analysis that have been standardized so that the variances of
dependent and independent variables are 1. Therefore, standardized coefficients refer to how many
standard deviations a dependent variable will change, per standard deviation increase in the predictor
variable. For simple linear regression, the absolute value of the unstandardized regression coefficient
equals the correlation between the independent and dependent variables.
Standardization of the coefficient is usually done to answer the question of which of the independent
variables have a greater effect on the dependent variable in a multiple regression analysis, when the
variables are measured in different units of measurement (for example, income measured in dollars and
family size measured in number of individuals).
Interpretation of regression coefficients
Y= a + b * X → linear regression line
Constant/b0 or a: value of if X = 0. Intuitive meaning?
- Expected wage if experience = 0
- Expected weight if length = 0...
b0 has an intuitive interpretation...
- if X=0 is a plausible situation
Be careful with data extrapolation!
We typically mean-center
- deduct the mean from every value
- we’ll see it again!
Then, constant: value of of X = the mean of X!
2
,Slope: difference in if X increases with one unit
- The expected ‘rate of change’ in Y
o What the regression says will happen → expected! Not the truth
What happens when we standardize both X and Y?
- has mean = 0, standard deviation = 1
Interpretation of standardized coefficient (beta): if X goes up with one standard deviation, then Y increases
by beta standard deviations
With standardization, the constant is always 0
-
- So, the regression equation becomes:
If there are beta’s, there is no a
Standardized and unstandardised
In bivariate regression the beta is equal to the correlation coefficient differ from
each other:
- b1 depends on the measurement unit. 𝑟xy doesn’t!
- 𝑟xy depends on the range of the variable. b1 doesn’t!
- 𝑟xy goes down if there is a third variable Z that affects Y but is not correlated with X. b1 doesn’t!
That's why we use 𝑏1 and 𝑟xy in other occasions:
- b1 is a better measure of the effect of X on Y
- 𝑟xy/beta is a better measure of predictive power, relative importance and statistical significance
o How strong is a relationship
Let’s focus on residuals
You have heard smth on them...
3
, Difference reality – regression line: residual
But then what does mean? A ‘Model’
- Model = an approximation of reality
The price you pay for simplicity
How does this model work
- Association between an independent (𝑌) and a dependent variable (𝑋)
- With a line instead of a scatterplot
But which line is correct?
- Or else: which line approximates best reality?
- Or else: which line explains best the association between Y and X?
- Or else: which values of 𝑏0 and 𝑏1 ‘fit’ best our data?
Solution: least squares method
Specifically: reduce error. Error = residual
- Make residuals as low as possible!
Reduce the sum ?
- There are positive and negative ones
- But cancel each other out...
So, we add a square: 2
- If you square it, it will never be negative
Aim of regression: find b0 and b1 that minimize 2
4