MARKET RESEARCH
METHODS
EXERCISES
SAM STROO
, 1
PART 1: FACTOR ANALYSIS
CHECK THE STATISTICAL ASSUMPTIONS IN SPSS
ó We are looking for multicollinearity between the variables, and we can check this by using 4 measures
1. Correlation matrix
2. Partial correlation/ Anti-image correlation matrix
3. Bartlett’s test of sphericity
4. KMO
THE MEASURES
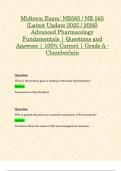
1. CORRELATION MATRIX
I = table showing the intercorrelations among all variables
I Visual inspection: high (>.30) and not equal (because some structure must exist, because it would
mean that all variables can be grouped together in one factor)
I It is a symmetrical table and the correlation with the same variable is off course 1
I You have to ask for the correlation matrix separately, but you only need to ask for it once at the
beginning of the factor analysis to show that it is meaningful to do the factor analysis
ANALYZE > CORRELATE > BIVARIATE
Here we see the shared correlation between two variables ó Anti-image correlation: the correlation that is left
to be unexplained (we want partial correlation to be as low as possible)
, 2
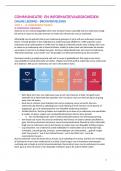
2. PARTIAL CORRELATION/ANTI-IMAGE CORRELATION MATRIX
o Calculate partial correlation (Analyze > Correlate > Partial) = the correlation between 2 variables that
remains when the effects of other variables are taken into account
o Partial correlation should be low (high = .7) > look at the absolute values
o Anti-image correlation matrix: negative values of partial correlation should all be low
o To get this, we need to check Anti-image (tab descriptives) when we do the PCA analysis in SPSS
ANALYZE > DIMENSION REDUCTION > FACTOR > DESCRIPTIVES
! LOOK AT ANTI-IMAGE CORRELATION, NOT AT THE COVARIANCE ONE!
3. BARLETT’S TEST OF SPHERICITY
ð Are the variables significantly correlated or not?
ð H0: correlation matrix = identity matrix (i.e. the variables are uncorrelated, 1 on the diagonal but
everywhere else it is zero and it means that the variables are uncorrelated and we do not want this)
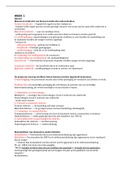
4. MEASURE OF SAMPLING ADEQUACY (KMO)
= Kaiser-Meyer-Olkin Measure of Sampling Adequacy
= measure calculated for both the entire correlation matrix and each individual variable (see diagonal on anti-
image for individual scores)
, 3
ð Ranges from 0 to 1
ð .80: meritorious/ .70: average / .60: mediocre/ .50: absolute minimum/ <.50: unacceptable
ð We get this by checking KMO and Barlett’s test of sphericity with descriptives
ð We could also see the individual KMO’s in the anti-image correlation table (with an ‘a’ above it)
ASSUMPTIONS IN SUMMARY
ð Strong conceptual foundation (structure exists)/ Variables: metric (NOT binary or categorical), 3-5
items per factor, parsimonious/ Sample size: >100, 10:1 / Everything needs to be on the same scale
ð Correlation matrix: high, not equal / Partial correlation,Anti-image: low values above & below diagonal
ð Bartlett’s test of sphericity: significant & KMO: >.50 // >.60
RUNNING A PCA IN SPSS
Exercise with data pleasure and planning: A supermarket chain asked 500 of its customers to fill in a
questionnaire which contained 12 questions about shopping behaviour, all on a 7 point Likert scale
ð 2 underlying dimensions found: pleasure and planning (confirmatory factor analysis, but if we don’t
know it beforehand it is exploratory)
ð Next: perform PCA analysis
ANALYZE > DIMENSION REDUCTION > FACTOR
- Descriptives: initial solution, KMO, anti-image
- Extraction: principal components, correlation matrix (not in ouput, but standardizes the items for
you), unrotated solution, scree plot, eigenvalues >1 (because it is an exploratory factor analysis)
- Rotation: varimax (= rotation method), rotated solution
- Options: exclude cases listwide, sorted by size (to sort them), suppress small coefficients (to get a
better overview)
METHODS
EXERCISES
SAM STROO
, 1
PART 1: FACTOR ANALYSIS
CHECK THE STATISTICAL ASSUMPTIONS IN SPSS
ó We are looking for multicollinearity between the variables, and we can check this by using 4 measures
1. Correlation matrix
2. Partial correlation/ Anti-image correlation matrix
3. Bartlett’s test of sphericity
4. KMO
THE MEASURES
1. CORRELATION MATRIX
I = table showing the intercorrelations among all variables
I Visual inspection: high (>.30) and not equal (because some structure must exist, because it would
mean that all variables can be grouped together in one factor)
I It is a symmetrical table and the correlation with the same variable is off course 1
I You have to ask for the correlation matrix separately, but you only need to ask for it once at the
beginning of the factor analysis to show that it is meaningful to do the factor analysis
ANALYZE > CORRELATE > BIVARIATE
Here we see the shared correlation between two variables ó Anti-image correlation: the correlation that is left
to be unexplained (we want partial correlation to be as low as possible)
, 2
2. PARTIAL CORRELATION/ANTI-IMAGE CORRELATION MATRIX
o Calculate partial correlation (Analyze > Correlate > Partial) = the correlation between 2 variables that
remains when the effects of other variables are taken into account
o Partial correlation should be low (high = .7) > look at the absolute values
o Anti-image correlation matrix: negative values of partial correlation should all be low
o To get this, we need to check Anti-image (tab descriptives) when we do the PCA analysis in SPSS
ANALYZE > DIMENSION REDUCTION > FACTOR > DESCRIPTIVES
! LOOK AT ANTI-IMAGE CORRELATION, NOT AT THE COVARIANCE ONE!
3. BARLETT’S TEST OF SPHERICITY
ð Are the variables significantly correlated or not?
ð H0: correlation matrix = identity matrix (i.e. the variables are uncorrelated, 1 on the diagonal but
everywhere else it is zero and it means that the variables are uncorrelated and we do not want this)
4. MEASURE OF SAMPLING ADEQUACY (KMO)
= Kaiser-Meyer-Olkin Measure of Sampling Adequacy
= measure calculated for both the entire correlation matrix and each individual variable (see diagonal on anti-
image for individual scores)
, 3
ð Ranges from 0 to 1
ð .80: meritorious/ .70: average / .60: mediocre/ .50: absolute minimum/ <.50: unacceptable
ð We get this by checking KMO and Barlett’s test of sphericity with descriptives
ð We could also see the individual KMO’s in the anti-image correlation table (with an ‘a’ above it)
ASSUMPTIONS IN SUMMARY
ð Strong conceptual foundation (structure exists)/ Variables: metric (NOT binary or categorical), 3-5
items per factor, parsimonious/ Sample size: >100, 10:1 / Everything needs to be on the same scale
ð Correlation matrix: high, not equal / Partial correlation,Anti-image: low values above & below diagonal
ð Bartlett’s test of sphericity: significant & KMO: >.50 // >.60
RUNNING A PCA IN SPSS
Exercise with data pleasure and planning: A supermarket chain asked 500 of its customers to fill in a
questionnaire which contained 12 questions about shopping behaviour, all on a 7 point Likert scale
ð 2 underlying dimensions found: pleasure and planning (confirmatory factor analysis, but if we don’t
know it beforehand it is exploratory)
ð Next: perform PCA analysis
ANALYZE > DIMENSION REDUCTION > FACTOR
- Descriptives: initial solution, KMO, anti-image
- Extraction: principal components, correlation matrix (not in ouput, but standardizes the items for
you), unrotated solution, scree plot, eigenvalues >1 (because it is an exploratory factor analysis)
- Rotation: varimax (= rotation method), rotated solution
- Options: exclude cases listwide, sorted by size (to sort them), suppress small coefficients (to get a
better overview)