Sophia Statistics Final Milestone
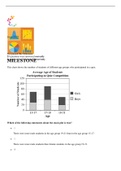
Sophia Statistics Final Milestone This chart shows the number of students of different age groups who participated in a quiz. Which of the following statements about the stack plot is true? There were more male students in the age group 19-21 than in the age group 15-17. There were more male students than female students in the age group 19-21. There were more female students in the age group 17-19 than in any other age group. There were more students in the age group 15-17 than in any other age group. Which of the scenarios below will provide Jay with available data? Going to a local high school and asking the principal for information about students' previous grades, then interviewing a random selection of students about their eating habits. Going to a local high school and asking the principal for information about students' current and previous grades, then interviewing a random selection of students about their eating habits. Going to a local high school and asking the principal for information about students' current and previous grades, then asking the health teacher for the results from a survey students took in health class. Going to a local college and asking current undergraduates to report their grades and eating habits from high school.
Escuela, estudio y materia
- Institución
- Metropolitan Community College
- Grado
- Sophia Statistics Final Milestone
Información del documento
- Subido en
- 8 de abril de 2021
- Número de páginas
- 21
- Escrito en
- 2020/2021
- Tipo
- Examen
- Contiene
- Preguntas y respuestas
Temas
-
sophia statistics final milestone
Documento también disponible en un lote