Generalized linear modeling
Review of regression basics
Sample vs population
How do we denote the true population parameter?
What we want to know?
How do we denote the sample estimate? What we
calculate in R? -> µ
What is the difference between µ and 𝑥̅
The notation with the ^ on it in Latin are the fitted
values in the model (estimates)
Variables and the coordinate system
What is the outcome or response variable? -> dependent variable, gives the outcome of the formula,
what you are trying to study
- Denoted by y (or 𝑦̅)
What is the predictor or covariate? -> independent variable, what you are trying to use to explain the
response
- Denoted by x
The response will be on the y-axis, and the covariate on the x-axis. Example: blood pressure and age,
blood pressure does not change the age so the age would be on the x-axis.
The foundation: equation of a straight line
What is the standard equation for a straight line -> 𝑦 = 𝑎𝑥 + 𝑏
a is the slope -> how steep the line will be, if x increases by 1 then y will increase by a
b is the intercept -> the crossing with the y-axis, value of y when x=0
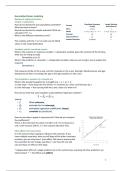
How do we write that same equation using statistical regression notation?
How can we draw a graph to represent this? How do you interpret
the coefficients?
The ß0 is the intercept, the value of y when x=0. If x increases by 1
unit, it will increase with ß1. 𝑦̅ is the outcome (the blue line).
Main effects and interactions
It is the only one that is going to influence the outcome. If you
have multiple covariates, then you will keep all the other covariates
constant, you can only have 1 main effect. We have to assume that
the covariates do not change, stay fixed -> see how the one will
vary and have an effect on the slope.
* Independent effect of a single predictor (x) on the outcome (y), assuming all other predictors are
held constant. * -> the effects are additive
1
,What is an interaction?
2 variables are not changing independently from each other -> they are both changing one with the
other -> 1 predictor is dependent on the other, example is diabetes -> as we get older we have a
higher risk of diabetes, if we look at BMI we also have a higher risk of diabetes -> looking at the 2
together is not just the sum of those 2, it is actually higher (this is called interaction).
* Occurs when the effect of one predictor on the outcome depends on the level of another
predictor.* -> the effects are multiplicative
Model specification
The Wilkinson and Rogers notation
We need to understand our notation to understand our question -> we don’t write down ß1, ß2, etc.
since it is a linear model we can see where they fit. Wilkinson and rogers came up with a notation ->
response ~ predictor(s)
The intercept model:
What do we use to explain our outcomes? The intercept
model is basically when you’re not putting any covariates
in the model -> we are modeling it as 1.
𝑦~1
𝐵𝑙𝑜𝑜𝑑 𝑝𝑟𝑒𝑠𝑠𝑢𝑟𝑒 ~1
One main effect:
𝑦~𝑥1
𝐵𝑙𝑜𝑜𝑑 𝑝𝑟𝑒𝑠𝑠𝑢𝑟𝑒 ~𝐵𝑀𝐼
The ß0 is always there but we don’t write it all the time
Additive main effects:
𝑦~𝑥1 + 𝑥2
𝐵𝑙𝑜𝑜𝑑 𝑝𝑟𝑒𝑠𝑠𝑢𝑟𝑒 ~𝐵𝑀𝐼 + 𝐴𝑔𝑒
Interaction effect:
𝑦~𝑥1 : 𝑥2
𝐵𝑙𝑜𝑜𝑑 𝑝𝑟𝑒𝑠𝑠𝑢𝑟𝑒 ~𝐵𝑀𝐼: 𝐴𝑔𝑒
Full model:
𝑦~𝑥1 ∗ 𝑥2
𝑦~𝑥1 + 𝑥2 + 𝑥1 : 𝑥2
𝐵𝑙𝑜𝑜𝑑 𝑝𝑟𝑒𝑠𝑠𝑢𝑟𝑒 ~𝐵𝑀𝐼 ∗ 𝐴𝑔𝑒
This notation is the same as 𝐵𝑙𝑜𝑜𝑑 𝑝𝑟𝑒𝑠𝑠𝑢𝑟𝑒 ~𝐵𝑀𝐼 + 𝐴𝑔𝑒 + 𝐵𝑀𝐼: 𝐴𝑔𝑒
This notation is also much easier than just writing all the symbols together.
Nested model:
𝑦~𝑥1 /𝑥2
𝑦~𝑥1 + 𝑥1 : 𝑥2
𝐵𝑙𝑜𝑜𝑑 𝑝𝑟𝑒𝑠𝑠𝑢𝑟𝑒 ~𝐵𝑀𝐼/𝐴𝑔𝑒
𝐵𝑙𝑜𝑜𝑑 𝑝𝑟𝑒𝑠𝑠𝑢𝑟𝑒 ~𝐵𝑀𝐼 + 𝐵𝑀𝐼: 𝐴𝑔𝑒 -> it only includes one main effect and the interaction. Why do
we want this? Sometimes it can be very useful but other times it will be useless. See later for
examples.
2
,An overview:
Model hierarchy
The principle of marginality
A model is considered hierarchical if, whenever an interaction term is included, all of its main effects
are also included.
- You cannot interpret an interaction (x1:x2) if you do not also include the main effects (x1 and
x2)
It is important to have a model that has the main effect in it ->your interaction coefficients will be
there only when your main effects are there. You cannot interpret the interaction term correctly if
you do not take the main effect into account.
Examples:
Model 1: 𝑦~𝑥1 : 𝑥2
This is a bad model, as it only has the interaction term, it is missing the main effects of x1 and x2.
Model 2: 𝑦~𝑥1 ∗ 𝑥2 or 𝑦~𝑥1 + 𝑥2 + 𝑥1 : 𝑥2
This is a good model because it has both the interaction and the main effects.
The intercept model
What does the intercept model (𝑦~1 or 𝑦̂ = 𝛽0) mean?
The response is not depending on anything -> the line is parallel to the x-axis, the value is the mean
-> it is predicting the mean, we don’t have any variables to do anything with the model, if you don’t
split in male/female for example we can use the global mean. It predicts the mean of the response
variable (𝑦̅). This implies that no covariate has a meaningful relationship with the outcome.
What would a 2x2 table look like?
We use BMI in over and under 30, and age in over and under 30 -> 2
possibilities for age and BMI. It will all be the same, we said we don’t have
any difference between the groups and we have the global means so
nothing changes. If we look at the line it would be horizontal.
3
, Introducing predictors
The single main effect model
Model with one main effect: 𝑦~𝑥1 or 𝑦̅ = 𝛽0 + 𝛽1 𝑥1
How do we interpret the coefficient in this case? It is just a straight line, the one thing we need to
concentrate on is the slope -> ß1
What would a 2x2 table look like?
We don’t have 4 identical numbers anymore -> they wouldn’t be the
same, if age can take 2 possibilities than the first column would just
be the intercept, the second column would be a different number
than the first one. Age will have an effect if you use binary -> age
under 30 is 0 so you only have the intercept. If you have age over 30
as 1 then it would also be 1 in the formula and you get the intercept +
the slope.
The line is still straight but it now has a
slope. The interpretation will be different
depending on the variable being
continuous or not.
Model with two main effects
Model with two main effects (or more effects): 𝑦~𝑥1 + 𝑥2 + ⋯ or 𝑦̅ = 𝛽0 + 𝛽1 𝑥1 + 𝛽2 𝛽2 + ⋯
We can hold 1 constant and see how the other is changing, this one has multiple slopes because you
can look at each one independently. The effects of xi on 𝑦̂ are entirely independent and additive. It is
interpreted the same as with one main effect!
What would a 2x2 table look like?
We have an effect between the lines and an
effect between the columns. If we keep one of
these fixed (say
BMI), we can
see what the
slope will be of
age. Age influences the blood pressure by 6.84. We can look at the
reverse, fix age and BMI increases blood pressure by 4.9. If we want
to change both at the same time, we need to add both coefficients
(6.48 and 4.9). if you look at all of these we can just add them all up.
If we just use age and BMI as normal numbers instead of binary ->
we need an x1 and x2 -> we are getting a 3D plot -> this 3D plot will
represent a sheet of paper. If we fix 1 value we just get a straight line
of the other (the slope will remain the same, but the line will shift
towards the fixed value of the other).
4
Review of regression basics
Sample vs population
How do we denote the true population parameter?
What we want to know?
How do we denote the sample estimate? What we
calculate in R? -> µ
What is the difference between µ and 𝑥̅
The notation with the ^ on it in Latin are the fitted
values in the model (estimates)
Variables and the coordinate system
What is the outcome or response variable? -> dependent variable, gives the outcome of the formula,
what you are trying to study
- Denoted by y (or 𝑦̅)
What is the predictor or covariate? -> independent variable, what you are trying to use to explain the
response
- Denoted by x
The response will be on the y-axis, and the covariate on the x-axis. Example: blood pressure and age,
blood pressure does not change the age so the age would be on the x-axis.
The foundation: equation of a straight line
What is the standard equation for a straight line -> 𝑦 = 𝑎𝑥 + 𝑏
a is the slope -> how steep the line will be, if x increases by 1 then y will increase by a
b is the intercept -> the crossing with the y-axis, value of y when x=0
How do we write that same equation using statistical regression notation?
How can we draw a graph to represent this? How do you interpret
the coefficients?
The ß0 is the intercept, the value of y when x=0. If x increases by 1
unit, it will increase with ß1. 𝑦̅ is the outcome (the blue line).
Main effects and interactions
It is the only one that is going to influence the outcome. If you
have multiple covariates, then you will keep all the other covariates
constant, you can only have 1 main effect. We have to assume that
the covariates do not change, stay fixed -> see how the one will
vary and have an effect on the slope.
* Independent effect of a single predictor (x) on the outcome (y), assuming all other predictors are
held constant. * -> the effects are additive
1
,What is an interaction?
2 variables are not changing independently from each other -> they are both changing one with the
other -> 1 predictor is dependent on the other, example is diabetes -> as we get older we have a
higher risk of diabetes, if we look at BMI we also have a higher risk of diabetes -> looking at the 2
together is not just the sum of those 2, it is actually higher (this is called interaction).
* Occurs when the effect of one predictor on the outcome depends on the level of another
predictor.* -> the effects are multiplicative
Model specification
The Wilkinson and Rogers notation
We need to understand our notation to understand our question -> we don’t write down ß1, ß2, etc.
since it is a linear model we can see where they fit. Wilkinson and rogers came up with a notation ->
response ~ predictor(s)
The intercept model:
What do we use to explain our outcomes? The intercept
model is basically when you’re not putting any covariates
in the model -> we are modeling it as 1.
𝑦~1
𝐵𝑙𝑜𝑜𝑑 𝑝𝑟𝑒𝑠𝑠𝑢𝑟𝑒 ~1
One main effect:
𝑦~𝑥1
𝐵𝑙𝑜𝑜𝑑 𝑝𝑟𝑒𝑠𝑠𝑢𝑟𝑒 ~𝐵𝑀𝐼
The ß0 is always there but we don’t write it all the time
Additive main effects:
𝑦~𝑥1 + 𝑥2
𝐵𝑙𝑜𝑜𝑑 𝑝𝑟𝑒𝑠𝑠𝑢𝑟𝑒 ~𝐵𝑀𝐼 + 𝐴𝑔𝑒
Interaction effect:
𝑦~𝑥1 : 𝑥2
𝐵𝑙𝑜𝑜𝑑 𝑝𝑟𝑒𝑠𝑠𝑢𝑟𝑒 ~𝐵𝑀𝐼: 𝐴𝑔𝑒
Full model:
𝑦~𝑥1 ∗ 𝑥2
𝑦~𝑥1 + 𝑥2 + 𝑥1 : 𝑥2
𝐵𝑙𝑜𝑜𝑑 𝑝𝑟𝑒𝑠𝑠𝑢𝑟𝑒 ~𝐵𝑀𝐼 ∗ 𝐴𝑔𝑒
This notation is the same as 𝐵𝑙𝑜𝑜𝑑 𝑝𝑟𝑒𝑠𝑠𝑢𝑟𝑒 ~𝐵𝑀𝐼 + 𝐴𝑔𝑒 + 𝐵𝑀𝐼: 𝐴𝑔𝑒
This notation is also much easier than just writing all the symbols together.
Nested model:
𝑦~𝑥1 /𝑥2
𝑦~𝑥1 + 𝑥1 : 𝑥2
𝐵𝑙𝑜𝑜𝑑 𝑝𝑟𝑒𝑠𝑠𝑢𝑟𝑒 ~𝐵𝑀𝐼/𝐴𝑔𝑒
𝐵𝑙𝑜𝑜𝑑 𝑝𝑟𝑒𝑠𝑠𝑢𝑟𝑒 ~𝐵𝑀𝐼 + 𝐵𝑀𝐼: 𝐴𝑔𝑒 -> it only includes one main effect and the interaction. Why do
we want this? Sometimes it can be very useful but other times it will be useless. See later for
examples.
2
,An overview:
Model hierarchy
The principle of marginality
A model is considered hierarchical if, whenever an interaction term is included, all of its main effects
are also included.
- You cannot interpret an interaction (x1:x2) if you do not also include the main effects (x1 and
x2)
It is important to have a model that has the main effect in it ->your interaction coefficients will be
there only when your main effects are there. You cannot interpret the interaction term correctly if
you do not take the main effect into account.
Examples:
Model 1: 𝑦~𝑥1 : 𝑥2
This is a bad model, as it only has the interaction term, it is missing the main effects of x1 and x2.
Model 2: 𝑦~𝑥1 ∗ 𝑥2 or 𝑦~𝑥1 + 𝑥2 + 𝑥1 : 𝑥2
This is a good model because it has both the interaction and the main effects.
The intercept model
What does the intercept model (𝑦~1 or 𝑦̂ = 𝛽0) mean?
The response is not depending on anything -> the line is parallel to the x-axis, the value is the mean
-> it is predicting the mean, we don’t have any variables to do anything with the model, if you don’t
split in male/female for example we can use the global mean. It predicts the mean of the response
variable (𝑦̅). This implies that no covariate has a meaningful relationship with the outcome.
What would a 2x2 table look like?
We use BMI in over and under 30, and age in over and under 30 -> 2
possibilities for age and BMI. It will all be the same, we said we don’t have
any difference between the groups and we have the global means so
nothing changes. If we look at the line it would be horizontal.
3
, Introducing predictors
The single main effect model
Model with one main effect: 𝑦~𝑥1 or 𝑦̅ = 𝛽0 + 𝛽1 𝑥1
How do we interpret the coefficient in this case? It is just a straight line, the one thing we need to
concentrate on is the slope -> ß1
What would a 2x2 table look like?
We don’t have 4 identical numbers anymore -> they wouldn’t be the
same, if age can take 2 possibilities than the first column would just
be the intercept, the second column would be a different number
than the first one. Age will have an effect if you use binary -> age
under 30 is 0 so you only have the intercept. If you have age over 30
as 1 then it would also be 1 in the formula and you get the intercept +
the slope.
The line is still straight but it now has a
slope. The interpretation will be different
depending on the variable being
continuous or not.
Model with two main effects
Model with two main effects (or more effects): 𝑦~𝑥1 + 𝑥2 + ⋯ or 𝑦̅ = 𝛽0 + 𝛽1 𝑥1 + 𝛽2 𝛽2 + ⋯
We can hold 1 constant and see how the other is changing, this one has multiple slopes because you
can look at each one independently. The effects of xi on 𝑦̂ are entirely independent and additive. It is
interpreted the same as with one main effect!
What would a 2x2 table look like?
We have an effect between the lines and an
effect between the columns. If we keep one of
these fixed (say
BMI), we can
see what the
slope will be of
age. Age influences the blood pressure by 6.84. We can look at the
reverse, fix age and BMI increases blood pressure by 4.9. If we want
to change both at the same time, we need to add both coefficients
(6.48 and 4.9). if you look at all of these we can just add them all up.
If we just use age and BMI as normal numbers instead of binary ->
we need an x1 and x2 -> we are getting a 3D plot -> this 3D plot will
represent a sheet of paper. If we fix 1 value we just get a straight line
of the other (the slope will remain the same, but the line will shift
towards the fixed value of the other).
4