Statistics sophia 4 scatterplot - Study guides, Study notes & Summaries
Looking for the best study guides, study notes and summaries about Statistics sophia 4 scatterplot -? On this page you'll find 9 study documents about Statistics sophia 4 scatterplot -.
All 9 results
Sort by
-
MAT 300 STATISTICS MILESTONE 4 Latest Review 2023 Practice Questions and Answers, 100% Correct with Explanations, Highly Recommended, Download to Score A+
- Exam (elaborations) • 57 pages • 2023
- R348,33
- + learn more
MAT 300 STATISTICS MILESTONE 4 Latest Review 2023 Practice Questions and Answers, 100% Correct with Explanations, Highly Recommended, Download to Score A+ Using the formula below or Excel, find the correlation coefficient, r, for this set of tickets John drew. Answer choices are rounded to the nearest hundredth. 0.56 0.75 0.50 6/29/2020 Sophia :: Welcome 0.70 RATIONALE In order to get the correlation, we can use the formula: Correlation can be quickly calculated by using Excel. Enter...
-
MAT 300 Unit 4 Milestone 4 Sophia Latest Review 2023 Practice Questions and Answers, 100% Correct with Explanations, Highly Recommended, Download to Score A+
- Exam (elaborations) • 28 pages • 2023
- R348,33
- + learn more
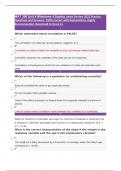
MAT 300 Unit 4 Milestone 4 Sophia Latest Review 2023 Practice Questions and Answers, 100% Correct with Explanations, Highly Recommended, Download to Score A+ 1 Which statement about correlation is FALSE? • The correlation of a data set can be positive, negative, or 0. • Correlation is used to define the variables of only non-linearly related data sets. • Correlation between the variables of the data set can be measured. • Correlation is the degree to which the two varia...
-
Milestone Unit 4 Statistics Sophia
- Exam (elaborations) • 14 pages • 2021
- R174,07
- 1x sold
- + learn more
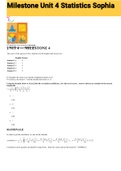
Exam (elaborations) Milestone Unit 4 Statistics Sophia 1 The scores of the quizzes of five students in both English and Science are: English Science Student 1 6 8 Student 2 5 5 Student 3 9 6 Student 4 4 7 Student 5 8 9 For English, the mean is 6.4 and the standard deviation is 2.0. For Science, the mean is 7 and the standard deviation is 1.6. Using the formula below or Excel, find the correlation coefficient, r, for this set of scores. Answer choices are rounded to the nearest hundr...
-
Sophia Statistics Final Milestone
- Exam (elaborations) • 22 pages • 2022
- R222,47
- + learn more
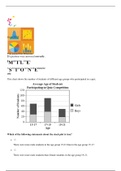
Sophia Statistics Final Milestone. Which of the following statements about the stack plot is true? There were more male students in the age group 19-21 than in the age group 15-17. There were more male students than female students in the age group 19-21. There were more female students in the age group 17-19 than in any other age group. There were more students in the age group 15-17 than in any other age group. RATIONALE If we note that the greatest area for the girls is the longest dar...

-
Exam (elaborations) Milestone Unit 4 Statistics Sophia
- Exam (elaborations) • 14 pages • 2022
- R145,02
- + learn more
Exam (elaborations) Milestone Unit 4 Statistics Sophia 1 The scores of the quizzes of five students in both English and Science are: English Science Student 1 6 8 Student 2 5 5 Student 3 9 6 Student 4 4 7 Student 5 8 9 For English, the mean is 6.4 and the standard deviation is 2.0. For Science, the mean is 7 and the standard deviation is 1.6. Using the formula below or Excel, find the correlation coefficient, r, for this set of scores. Answer choices are rounded to the nearest hundr...

And that's how you make extra money

-
Statistics Sophia 4
- Exam (elaborations) • 3 pages • 2024
- R309,60
- + learn more
Statistics Sophia 4 scatterplot - ANSWERSA graphical display that allows us to see the relationship between two quantitative variables. multiple data sets - ANSWERSPlotting more than one data set on a scatterplot requires that we use different colors or symbols for the different data sets so we can see the relationships separately. form - ANSWERSThe overall shape of the data points. The form may be linear or nonlinear, or there may not be any form at all to the points if they form a "clo...
-
Sophia Statistics Final Milestone WITH correct answers
- Exam (elaborations) • 22 pages • 2021
- R358,01
- + learn more
Sophia Statistics Final Milestone Score 21/25 This chart shows the number of students of different age groups who participated in a quiz. Which of the following statements about the stack plot is true? RATIONALE If we note that the greatest area for the girls is the longest darker region, this occurs in the age group 17-19. CONCEPT Stack Plots I need help with this question 2 Jay wants to study nutrition and performance in schools using available data. ...
-
Exam (elaborations) Sophia Statistics Unit 4 Milestone Questions Answers Rationale Latest Summer 2021
- Exam (elaborations) • 18 pages • 2021
- R299,92
- + learn more
The table below shows the grade and reading level for 5 students. Grade Reading Level Student 1 2 6 Student 2 6 14 Student 3 5 12 Student 4 4 10 Student 5 1 4 For grade, the mean is 3.6 and the standard deviation is 2.1. For reading level, the mean is 9.2 and the standard deviation is 4.1. Using the formula below or Excel, find the correlation coefficient, r, for this set of students. Answer choices are rounded to the nearest hundredth. 1.00 0.85 0.71 Sophia Statistics Unit 4 Miles...
-
Exam (elaborations) Milestone Final Statistics Sophia
- Exam (elaborations) • 21 pages • 2022
- R164,39
- + learn more
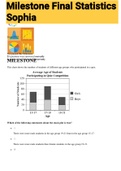
Exam (elaborations) Milestone Final Statistics Sophia his chart shows the number of students of different age groups who participated in a quiz. Which of the following statements about the stack plot is true? There were more male students in the age group 19-21 than in the age group 15-17. There were more male students than female students in the age group 19-21. Milestone Final Statistics Sophia There were more female students in the age group 17-19 than in any other age group. There w...
