Edf 6226 safmeds Study guides, Study notes & Summaries
Looking for the best study guides, study notes and summaries about Edf 6226 safmeds? On this page you'll find 9 study documents about Edf 6226 safmeds.
All 9 results
Sort by
-
EDF 6226 SAFMEDS 3 Exam Questions and Answers (Graded A)
- Exam (elaborations) • 2 pages • 2023
- Available in package deal
-
- R173,35
- + learn more
EDF 6226 SAFMEDS 3 Exam Questions and Answers (Graded A)
-
UPDATED LATEST EDF 6226 SAFMEDS 100% SOLUTIONS
- Exam (elaborations) • 4 pages • 2024
-
- R221,55
- + learn more
Data Path - ANSWER Represents the level and trend of behavior between successive data points Baseline - ANSWER Prior to starting an intervention, the therapist took ______ data steady state - ANSWER Nia eating 2 ounces of breads everyday for three weeks is an example of _______ ______ responding slope - ANSWER The standard celeration chart is a graph where the _______ of the line shows celeration trend - ANSWER The overall direction taken by a data path decreasing - ANSWER The directions...

-
UWF EDF 6226 Deck 3 (SAFMEDS Deck 3) with Complete Questions and Answers
- Exam (elaborations) • 3 pages • 2023
- Available in package deal
-
- R202,27
- + learn more
UWF EDF 6226 Deck 3 (SAFMEDS Deck 3) with Complete Questions and AnswersUWF EDF 6226 Deck 3 (SAFMEDS Deck 3) with Complete Questions and AnswersUWF EDF 6226 Deck 3 (SAFMEDS Deck 3) with Complete Questions and AnswersUWF EDF 6226 Deck 3 (SAFMEDS Deck 3) with Complete Questions and AnswersNia implements _________ _________ by varying the table decor, menu style, and background music during restaurant training. - ANSWER-teaching loosely Teaching loosely is increasing the variety of _______ _____...

-
EDF 6226 SAFMEDS 100% SOLUTIONS
- Exam (elaborations) • 4 pages • 2023
-
- R192,63
- + learn more
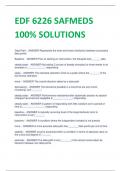
EDF 6226 SAFMEDS 100% SOLUTIONS Data Path - ANSWER Represents the level and trend of behavior between successive data points Baseline - ANSWER Prior to starting an intervention, the therapist took ______ data steady state - ANSWER Nia eating 2 ounces of breads everyday for three weeks is an example of _______ ______ responding slope - ANSWER The standard celeration chart is a graph where the _______ of the line shows celeration trend - ANSWER The overall direction taken by a data pa...

-
EDF_6226 Behavioral Assessment
- Exam (elaborations) • 6 pages • 2023
-
- R63,44
- + learn more
EDF_6226 Behavioral Assessment EDF 6226 BEHAVIORAL ASSESSMENTS Prerequisites Students must be eligible to enroll in Master’s level courses and have completed EDF 6225 with a grade of 82% (B) or higher. Course Description. This course serves to introduce assessment methodology of applied behavior analysis, including appropriate ethical considerations. Selecting and defining target behavior, as well as appropriate measurement systems are examined. The content is based on the Behavi...
-
EDF 6226 SAFMEDS 100% SOLUTIONS
- Exam (elaborations) • 4 pages • 2024
- Available in package deal
-
- R231,19
- + learn more
EDF 6226 SAFMEDS 100% SOLUTIONS Data Path - ANSWER Represents the level and trend of behavior between successive data points Baseline - ANSWER Prior to starting an intervention, the therapist took ______ data steady state - ANSWER Nia eating 2 ounces of breads everyday for three weeks is an example of _______ ______ responding slope - ANSWER The standard celeration chart is a graph where the _______ of the line shows celeration trend - ANSWER The overall direction taken by a data pa...

-
EDF 6226 SAFMEDS 100% SOLUTIONS
- Exam (elaborations) • 4 pages • 2024
- Available in package deal
-
- R192,63
- + learn more
EDF 6226 SAFMEDS 100% SOLUTIONS Data Path - ANSWER Represents the level and trend of behavior between successive data points Baseline - ANSWER Prior to starting an intervention, the therapist took ______ data steady state - ANSWER Nia eating 2 ounces of breads everyday for three weeks is an example of _______ ______ responding slope - ANSWER The standard celeration chart is a graph where the _______ of the line shows celeration trend - ANSWER The overall direction taken by a data pa...
EDF 6223 Exam 1 EDF 6226 Modules 1-6 EDF 6226 SAFMEDS EDF 6223 SAFMEDS DECK 1&2&3 6226 edf 7-9
-
EDF 6226 SAFMEDS 100% SOLUTIONS
- Exam (elaborations) • 4 pages • 2023
- Available in package deal
-
- R154,06
- + learn more
EDF 6226 SAFMEDS 100% SOLUTIONS Data Path - ANSWER Represents the level and trend of behavior between successive data points Baseline - ANSWER Prior to starting an intervention, the therapist took ______ data steady state - ANSWER Nia eating 2 ounces of breads everyday for three weeks is an example of _______ ______ responding slope - ANSWER The standard celeration chart is a graph where the _______ of the line shows celeration trend - ANSWER The overall direction taken by a data pa...

How did he do that? By selling his study notes on Stuvia. Try it yourself! Discover all about earning on Stuvia


