Page 2 out of 29 results
Sort by
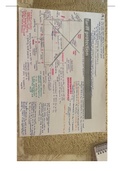
Figure 19-1, from chapter 19 from the textbook: economics of development by Perkins et al. 7th edition, shows the effects of protective tariffs on consumers, producers and the government.
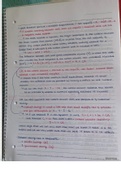
This is the second page of my summary notes of Chapter 15 Appendix that goes into more detail about GDP and Net factor income from abroad (NFIA)
-
17-10 Agricultural Production Functions & the Factor-Product Decision
- Class notes • 1 pages • 2021
-
- R135,73
- + learn more
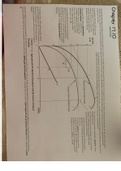
Graph 17-10, from chapter 17, shows the agricultural production functions and the factor-product decisions for farmers from the textbook: economics of development 7th edition by Perkins et al.
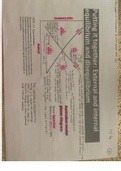
Graph 15-4 from chapter 15 of the textbook shows the Australian model phase diagram of the external and internal equilibrium and disequilibrium.
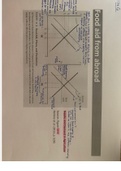
This graph 14-6 from chapter 14 explains food aid, prices and production and what occurs when there is an absence of imports.
This figure 17-9 is from chapter 17 from the textbook Economics of development 7th edition by Perkins et al. which illustrates farmers' factor-factor problem.
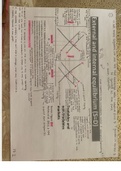
This graph, 15-5 from chapter 15 from the textbook shows tendencies toward equilibrium with the external and internal balance lines.
This is one page of my summary notes - the fourth page out of 7 pages on summarized notes of Chapter 14 from the textbook: Economics of Development, 7th edition by Perkins et al.
This is a continuation page from graph 15-1 from chapter 15 from the textbook explaining the Australian model's results.
This graph 15-2 from chapter 15 shows tradables and non-tradables markets (external and internal equilibrium).

How did he do that? By selling his study notes on Stuvia. Try it yourself! Discover all about earning on Stuvia

