CHAPTER 7: ANALYSIS OF VARIANCE (ANOVA)
1 What is analysis of variance?
Analysis of variance (ANOVA) is used when you want to compare the
means of more than 2 groups.
• T-test: compares 2 groups.
• ANOVA test: compares 3 or more groups.
ANOVA looks at variation (spread) in the data, and splits total variation into
1. Between-group variation: how far group means are from the.overall
……………………………….mean. ……………………………………………
2. Within-group variation: how spread out values are inside each group.
If between-group is much larger than within-group, it suggest that
the group means are not all equal.
Thus, we want to evaluate:
H0 : µ1 = µ2 = µ3 against H1 : At least one µj is different.
We analyse “variances” to answer this question:
Total variation sst
Cool
É is EEiassmcinb eas
observation in groupj
Between groups SSB nj x̅ x̅
mean ofgroupj
Within groups SSW SSE cocis x̅ ni 1 s
error d variance of
group
SST SSB SSW
2 Aim of ANOVA:
The aim is to find a test statistic (F-value) to evaluate the null hypothesis.
F Fk i n k x
MSB MSE
MSE SEP SEE
K ofgroups
BÉ eEf ups Er Elegroups
n of observations I If groupsdon'tdiffer ratio 1
α levelofsignificance at which If groupsdiffer ratio 1
weevaluatethenullhypothesis
, SST SSB SSW SSE
SSB
Fstat MSB
MSE SSE
n k
We then compare the F-value to the F-distribution with (k - 1, n - k) degrees
of freedom:
If value c α OR F Fk i n k α then reject H0.
p
p value P F Mss
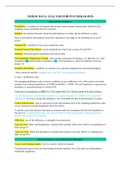
3 One-factor ANOVA Table:
4 The general linear model (GLM):
Each observation is a global mean + the group effect + some random error:
OCij M t αj Eij Random error Eij N O Oe
T.be hationthesed
ingroupj
TheseInteger
Eaten
ANOVA checks if those group effects are real (≠0) or just random variation.
Thus, we test:
Ho α 22 dk 0 Allgroupsare the same no effect
H at least 1 α 0
• If H0 can’t be rejected, then
Dcij M t Eij Null model
• If we reject H0, then we assume that at least 1 group explain the variation
of the data around the population mean: α
Mj M
Under the null model (all group are the same), every observation is just the
grand mean + some random error (which has a mean 0 by assumption).
SC µ E such that ECX M E X a ECX
gypgtendtnglysa
CX MTECE
M TO M GE
Each observation is a group mean + a random error:
OCij µ α Eij Mj Eij
1 What is analysis of variance?
Analysis of variance (ANOVA) is used when you want to compare the
means of more than 2 groups.
• T-test: compares 2 groups.
• ANOVA test: compares 3 or more groups.
ANOVA looks at variation (spread) in the data, and splits total variation into
1. Between-group variation: how far group means are from the.overall
……………………………….mean. ……………………………………………
2. Within-group variation: how spread out values are inside each group.
If between-group is much larger than within-group, it suggest that
the group means are not all equal.
Thus, we want to evaluate:
H0 : µ1 = µ2 = µ3 against H1 : At least one µj is different.
We analyse “variances” to answer this question:
Total variation sst
Cool
É is EEiassmcinb eas
observation in groupj
Between groups SSB nj x̅ x̅
mean ofgroupj
Within groups SSW SSE cocis x̅ ni 1 s
error d variance of
group
SST SSB SSW
2 Aim of ANOVA:
The aim is to find a test statistic (F-value) to evaluate the null hypothesis.
F Fk i n k x
MSB MSE
MSE SEP SEE
K ofgroups
BÉ eEf ups Er Elegroups
n of observations I If groupsdon'tdiffer ratio 1
α levelofsignificance at which If groupsdiffer ratio 1
weevaluatethenullhypothesis
, SST SSB SSW SSE
SSB
Fstat MSB
MSE SSE
n k
We then compare the F-value to the F-distribution with (k - 1, n - k) degrees
of freedom:
If value c α OR F Fk i n k α then reject H0.
p
p value P F Mss
3 One-factor ANOVA Table:
4 The general linear model (GLM):
Each observation is a global mean + the group effect + some random error:
OCij M t αj Eij Random error Eij N O Oe
T.be hationthesed
ingroupj
TheseInteger
Eaten
ANOVA checks if those group effects are real (≠0) or just random variation.
Thus, we test:
Ho α 22 dk 0 Allgroupsare the same no effect
H at least 1 α 0
• If H0 can’t be rejected, then
Dcij M t Eij Null model
• If we reject H0, then we assume that at least 1 group explain the variation
of the data around the population mean: α
Mj M
Under the null model (all group are the same), every observation is just the
grand mean + some random error (which has a mean 0 by assumption).
SC µ E such that ECX M E X a ECX
gypgtendtnglysa
CX MTECE
M TO M GE
Each observation is a group mean + a random error:
OCij µ α Eij Mj Eij