CHAPTER 2 SIMPLELINEARREGRESSION CORRELATION
This chapter coversregressionanalysis method used to study the
relationship between 2 more variables between 2 variables
1 Thepredictor Dc independent variable input
2 The response Y dependent variable output outcome
Thegoal of regression is to understand how the values of Y
change as is varied
We will use different tools to investigate the change
1 Scatter plots
Data is collected as pairs oci yi where i 1,2 n
In a scatter plot each data point 1 observation
Scatter plots help us visually test assumptions
The main uses of scatter plots are to
Identify linearrelationships regression line
2 Detect outliers 2 types 1 Vertical outliers in Y
2 Horizontal leverage points
3 Guide whether simple linear regression SLR is appropriate
2 The mean function
Whenwe build a regressionmodel we're asking on average how does Y
changewhen changes
The mean function is the mathematical way to express this
It describes the expected value average of the response variable
Y for a given predictor value X x
Formally E Y X c Bo Bix
E Y X c expected mean value of Y when takes
value x
parameters Bo intercept expectedY when X 0
β slope expectedchange in Y for a l unitchange in x
The mean function is the straight linedescribing the average
relationship between X Y theaverage trend of y as a changes
,3 The variance function
In real data not all observations he perfectly on the regression
line there's always some scatter around the line which represents
variability in Y not explained by X
Thevariability is captured by the variance function it answers
Howmuch does Y vary given a certain value of X
Is the scatter around the line constant for all x or does it get
larger smaller as
changes
Formally Var Y X x 02
02 In simple regression we start with theassumption
that the variance is constant across all so values
Homoscendasticity points are spread
evenly around the regression line
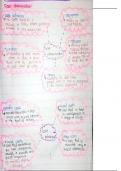
Eg Model price as a function of odometer
computesEh Estbetweengametes5.01 1
pdaisae.hr
EaYsEgfotme
tag 198 statecoetiaaomeee.ee pric
Regressionline
intercept
9 198gift slope
, 4 Simple linear regression SLR
SLR is the mathematicalmodel that formalises the relationship between
a prodictor X a response Y
Formally Yi E Y X xi te i BotBiocitei
ei random error residual
These are random variables not parameters and can
be estimated with
éi yi E Y X D yi Ji yi Bo Bisci
We assume the residuals ei have a mean of 0 E ei oci 0
We also assume that the errors are independent no
ThismodelsP És to
1 The mean function explains theaverageeffectof x
2 Therandom error explains the leftover variation notcapturedby x
The regression line
J Bo Bisci shows the trend the residuals
ei yi Ji show the scatter around the trend
5 Notation
This chapter coversregressionanalysis method used to study the
relationship between 2 more variables between 2 variables
1 Thepredictor Dc independent variable input
2 The response Y dependent variable output outcome
Thegoal of regression is to understand how the values of Y
change as is varied
We will use different tools to investigate the change
1 Scatter plots
Data is collected as pairs oci yi where i 1,2 n
In a scatter plot each data point 1 observation
Scatter plots help us visually test assumptions
The main uses of scatter plots are to
Identify linearrelationships regression line
2 Detect outliers 2 types 1 Vertical outliers in Y
2 Horizontal leverage points
3 Guide whether simple linear regression SLR is appropriate
2 The mean function
Whenwe build a regressionmodel we're asking on average how does Y
changewhen changes
The mean function is the mathematical way to express this
It describes the expected value average of the response variable
Y for a given predictor value X x
Formally E Y X c Bo Bix
E Y X c expected mean value of Y when takes
value x
parameters Bo intercept expectedY when X 0
β slope expectedchange in Y for a l unitchange in x
The mean function is the straight linedescribing the average
relationship between X Y theaverage trend of y as a changes
,3 The variance function
In real data not all observations he perfectly on the regression
line there's always some scatter around the line which represents
variability in Y not explained by X
Thevariability is captured by the variance function it answers
Howmuch does Y vary given a certain value of X
Is the scatter around the line constant for all x or does it get
larger smaller as
changes
Formally Var Y X x 02
02 In simple regression we start with theassumption
that the variance is constant across all so values
Homoscendasticity points are spread
evenly around the regression line
Eg Model price as a function of odometer
computesEh Estbetweengametes5.01 1
pdaisae.hr
EaYsEgfotme
tag 198 statecoetiaaomeee.ee pric
Regressionline
intercept
9 198gift slope
, 4 Simple linear regression SLR
SLR is the mathematicalmodel that formalises the relationship between
a prodictor X a response Y
Formally Yi E Y X xi te i BotBiocitei
ei random error residual
These are random variables not parameters and can
be estimated with
éi yi E Y X D yi Ji yi Bo Bisci
We assume the residuals ei have a mean of 0 E ei oci 0
We also assume that the errors are independent no
ThismodelsP És to
1 The mean function explains theaverageeffectof x
2 Therandom error explains the leftover variation notcapturedby x
The regression line
J Bo Bisci shows the trend the residuals
ei yi Ji show the scatter around the trend
5 Notation