Economics Ch 8
Ch 8 – The theory of demand: The indifference approach
8.1 Ordinal and Cardinal utility
Indifference approach to the analysis of the demand for goods and services is based on the notion of ordinal
utility.
We can see the difference between cardinal and ordinal magnitudes by considering the measurement of length.
- The metric scale is an example of a cardinal scale – it enables us to measure distances and allows
us to compare different distances with each other
o Distance A is 100m and distance B is 200m.
- The ordinal scale simply indicates that some distances are longer than others. Therefore we can
rank the distances.
o Distance A is shorter than distance B
Ordinal utility simply means that the satisfaction which a consumer obtains from consuming different
products can be ranked or ordered. The consumer can rank the products in order of preference but can say
nothing about the absolute level of satisfaction that each product yields - The size of utility differences cannot
be established.
8.2 Indifference curves
The indifference approach is based on 3 basic assumptions:
1. ASSUMPTIONS OF COMPLETENESS / LAW OF COMPARISON
= it is assumed that the consumer is able to rank all possible combinations of goods and services in
order of preference.
Example:
2 bundles of goods: bundle A – 3kg meat 2 dozen bottles of beer and bundle B – 2kg meat and 3 dozen
bottles of beer.
A consumer must then be able to say whether he or she prefers A to B, prefers B to A or is indifferent
to the differences between them (ie values them both equally).
2. ASSUMPTION OF CONSISTENCY / TRANSITIVITY
= consumers are assumed to act consistently.
3. ASSUMPTION OF NON-SATIATION / NON-SATIETY
= assumption that consumers are not yet fully satisfied and prefer more to less.
Given the basic assumptions, a consumers taste and preferences can be shown by means of an indifference
curve.
An indifference curve = curve that shows all the combinations of 2 products that will provide the consumer
with equal levels of satisfaction or utility. The combinations are equally desirable and the consumer is this
indifferent between them.
1
, Economics Ch 8
Example: Koos van der Merwe, who consumes only two products, bread and meat. Koos decides that it does not
matter to him whether he gets one portion of meat and six loaves of bread per week or two portions of meat
and three loaves of bread. These two combinations provide him with the same amount of satisfaction = he is
indifferent between them. He also indicates some other combinations
of meat and bread that will yield the same level of satisfaction
Combination Meat (portions Bread (loaves
per week) per week)
A 1 6
B 2 3
C 3 2
D 4 1.5
The points listed in the table, are not the only points between which Koos is indifferent – there are also other
(intermediate) combinations which yield the same level of satisfaction. The curve through points A, B, C and D
is called an indifference curve.
Points on curve represent different combinations of the 2 goods that are equally desirable or attractive to Koos.
The indifference curve bulges towards the origin – we say the curve is convex when it is viewed from the
origin.
As we move downwards to the right along the curve, the curve becomes flatter. This illustrates the law of
substitution, which is similar to the law of diminishing marginal utility.
U1 U3
Bread Meat Bread Meat
(loaves per (portions (Loaves per (portions
week) per week) week) per week)
6 0.5 6 1.5
4 1 4.5 2
2 2 3 3
1 3 2.25 4.5
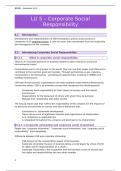
We can see that U2(from first table) represents a greater level of
satisfaction. Another important thing is that the curves don’t
intersect or touch each other.
It can easily be proven that such an intersection is impossible, given
our assumptions.
According to the definition of an indifference curve, all
combinations of bread and meat on a particular curve will yield
the same level of satisfaction or total utility to the consumer.
- Combinations B and C on curve 1 represent the same level of
satisfaction
- Similarly, B and H on curve 2 provide the consumer with the
same level of satisfaction.
- If B and C (on curve 1), and B and H (on curve 2) yield the
same level of satisfaction, then C and H should also yield
2
Ch 8 – The theory of demand: The indifference approach
8.1 Ordinal and Cardinal utility
Indifference approach to the analysis of the demand for goods and services is based on the notion of ordinal
utility.
We can see the difference between cardinal and ordinal magnitudes by considering the measurement of length.
- The metric scale is an example of a cardinal scale – it enables us to measure distances and allows
us to compare different distances with each other
o Distance A is 100m and distance B is 200m.
- The ordinal scale simply indicates that some distances are longer than others. Therefore we can
rank the distances.
o Distance A is shorter than distance B
Ordinal utility simply means that the satisfaction which a consumer obtains from consuming different
products can be ranked or ordered. The consumer can rank the products in order of preference but can say
nothing about the absolute level of satisfaction that each product yields - The size of utility differences cannot
be established.
8.2 Indifference curves
The indifference approach is based on 3 basic assumptions:
1. ASSUMPTIONS OF COMPLETENESS / LAW OF COMPARISON
= it is assumed that the consumer is able to rank all possible combinations of goods and services in
order of preference.
Example:
2 bundles of goods: bundle A – 3kg meat 2 dozen bottles of beer and bundle B – 2kg meat and 3 dozen
bottles of beer.
A consumer must then be able to say whether he or she prefers A to B, prefers B to A or is indifferent
to the differences between them (ie values them both equally).
2. ASSUMPTION OF CONSISTENCY / TRANSITIVITY
= consumers are assumed to act consistently.
3. ASSUMPTION OF NON-SATIATION / NON-SATIETY
= assumption that consumers are not yet fully satisfied and prefer more to less.
Given the basic assumptions, a consumers taste and preferences can be shown by means of an indifference
curve.
An indifference curve = curve that shows all the combinations of 2 products that will provide the consumer
with equal levels of satisfaction or utility. The combinations are equally desirable and the consumer is this
indifferent between them.
1
, Economics Ch 8
Example: Koos van der Merwe, who consumes only two products, bread and meat. Koos decides that it does not
matter to him whether he gets one portion of meat and six loaves of bread per week or two portions of meat
and three loaves of bread. These two combinations provide him with the same amount of satisfaction = he is
indifferent between them. He also indicates some other combinations
of meat and bread that will yield the same level of satisfaction
Combination Meat (portions Bread (loaves
per week) per week)
A 1 6
B 2 3
C 3 2
D 4 1.5
The points listed in the table, are not the only points between which Koos is indifferent – there are also other
(intermediate) combinations which yield the same level of satisfaction. The curve through points A, B, C and D
is called an indifference curve.
Points on curve represent different combinations of the 2 goods that are equally desirable or attractive to Koos.
The indifference curve bulges towards the origin – we say the curve is convex when it is viewed from the
origin.
As we move downwards to the right along the curve, the curve becomes flatter. This illustrates the law of
substitution, which is similar to the law of diminishing marginal utility.
U1 U3
Bread Meat Bread Meat
(loaves per (portions (Loaves per (portions
week) per week) week) per week)
6 0.5 6 1.5
4 1 4.5 2
2 2 3 3
1 3 2.25 4.5
We can see that U2(from first table) represents a greater level of
satisfaction. Another important thing is that the curves don’t
intersect or touch each other.
It can easily be proven that such an intersection is impossible, given
our assumptions.
According to the definition of an indifference curve, all
combinations of bread and meat on a particular curve will yield
the same level of satisfaction or total utility to the consumer.
- Combinations B and C on curve 1 represent the same level of
satisfaction
- Similarly, B and H on curve 2 provide the consumer with the
same level of satisfaction.
- If B and C (on curve 1), and B and H (on curve 2) yield the
same level of satisfaction, then C and H should also yield
2