Statistic
Grad 12 Note
Grade 11 Notes Revision
● Box and whisker
● Histogram
● Ogive
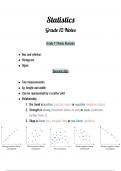
Bivarent data
● Two measurements
● Eg; height and width
● Can be represented by a scatter plot
● Relationship
1. the trend is positive (positive slope) or negative (negative slope)
2. Strength is strong (clustered closer to one) or weak (scattered
farther from 1)
3. Shap is linear (in a straight line) or non-linear (outliers)
Grad 12 Note
Grade 11 Notes Revision
● Box and whisker
● Histogram
● Ogive
Bivarent data
● Two measurements
● Eg; height and width
● Can be represented by a scatter plot
● Relationship
1. the trend is positive (positive slope) or negative (negative slope)
2. Strength is strong (clustered closer to one) or weak (scattered
farther from 1)
3. Shap is linear (in a straight line) or non-linear (outliers)