Exam (elaborations)
Showing_the_Right_Numbers_VisualAnalytics_Week5_NEC_Solved
- Course
- Institution
- Book
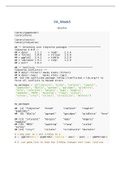
According to the author, 'ggplot is an implementation of the grammar of graphics' which is a set of rules for producing visualizations of data. In this first plot, we will track the trajectory of life expectancy over time for each country in the data. 1. map year to x and lifeExp to y. 2. use ge...
[Show more]