Statistic
Grad 11 Note
Normal stats
Mean - the average
Sum of All Events divided by the number of Events
A ected by Outliers eg: 50% 50% 50% 20%
Median - middle number
Mode - most common number
range - the di erence
Largest Number - Smallest Number
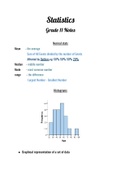
Histograms
● Graphical representation of a set of data
, Frequency Polygons
● Alternative graphical representation of data
● Unlike Histogram, trends are easily recognized
● Plot the frequencies against the midpoints of the class intervals before
and after given data
Grad 11 Note
Normal stats
Mean - the average
Sum of All Events divided by the number of Events
A ected by Outliers eg: 50% 50% 50% 20%
Median - middle number
Mode - most common number
range - the di erence
Largest Number - Smallest Number
Histograms
● Graphical representation of a set of data
, Frequency Polygons
● Alternative graphical representation of data
● Unlike Histogram, trends are easily recognized
● Plot the frequencies against the midpoints of the class intervals before
and after given data