Financial Accounting of a Sole Trader –
Interpretation of financial statements
The owner of a business should analyse the financial statements to determine the
following:
If the owner is earning a good return on capital invested in the business, and whether
it was worth the risk.
How the business is performing compared to previous financial periods, as well as
compared to other similar businesses.
Whether the business has achieved certain goals that were set.
What influence certain managerial decisions have had on the business.
Whether there is adequate cost control.
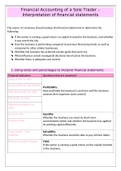
1. Using ratios and percentages to interpret financial statements:
Financial indicators Questions that are answered
Gross profit on sales
Gross profit on cost of sales
Profitability:
Operating profit on sales How profitable the business is and how well the business
controls their expenses (cost control)
Net profit on sales
Operating expenses on
sales
Current ratio Liquidity:
Whether the business can meet its short-term
Acid test ratio commitments (debt) and whether the business has applied
its working capital efficiently.
Total assets : Total Solvability:
liabilities Whether the business would be able to pay all their debts.
Return on owner’s equity Yield:
If the owner is earning a good return on the capital invested
in the business.
, Once the above ratios and percentages have been calculated, they can be interpreted and
analysed according to the following guidelines:
Compare them to the previous
year’s figures to see whether
there is an increase or decrease
and analyse what this means.
Compare figures to those of
other similar businesses.
These are several factors that could influence the ratios, such as how long the business has
been trading, whether there has been any expansion or whether the business has changed
policies, such as the purchasing policy. The following table contains the ratios and
percentages with possible comments that could be made:
Financial indicators Ratio Possible comments
Percentage gross Gross profit 100 Bothe equations test whether the
×
profit on cost of sales Cost of sales 1 business meets its profit mark-
up.
The percentage is compared to
that of the previous year.
If it is below the mark-up, it could
be due to:
- Too much discount allowed
Percentage gross Gross profit 100 during sales.
×
profit on sales Sales/ Turnover 1 - Mistakes were made when
recording prices, source
documents or in books.
- Strong competition caused
prices to drop.
- Suppliers have increased
their prices.
Operating profit on Operating profit 100 This percentage tests the cost
×
sales Sales /Turnover 1 control of the business – the
Interpretation of financial statements
The owner of a business should analyse the financial statements to determine the
following:
If the owner is earning a good return on capital invested in the business, and whether
it was worth the risk.
How the business is performing compared to previous financial periods, as well as
compared to other similar businesses.
Whether the business has achieved certain goals that were set.
What influence certain managerial decisions have had on the business.
Whether there is adequate cost control.
1. Using ratios and percentages to interpret financial statements:
Financial indicators Questions that are answered
Gross profit on sales
Gross profit on cost of sales
Profitability:
Operating profit on sales How profitable the business is and how well the business
controls their expenses (cost control)
Net profit on sales
Operating expenses on
sales
Current ratio Liquidity:
Whether the business can meet its short-term
Acid test ratio commitments (debt) and whether the business has applied
its working capital efficiently.
Total assets : Total Solvability:
liabilities Whether the business would be able to pay all their debts.
Return on owner’s equity Yield:
If the owner is earning a good return on the capital invested
in the business.
, Once the above ratios and percentages have been calculated, they can be interpreted and
analysed according to the following guidelines:
Compare them to the previous
year’s figures to see whether
there is an increase or decrease
and analyse what this means.
Compare figures to those of
other similar businesses.
These are several factors that could influence the ratios, such as how long the business has
been trading, whether there has been any expansion or whether the business has changed
policies, such as the purchasing policy. The following table contains the ratios and
percentages with possible comments that could be made:
Financial indicators Ratio Possible comments
Percentage gross Gross profit 100 Bothe equations test whether the
×
profit on cost of sales Cost of sales 1 business meets its profit mark-
up.
The percentage is compared to
that of the previous year.
If it is below the mark-up, it could
be due to:
- Too much discount allowed
Percentage gross Gross profit 100 during sales.
×
profit on sales Sales/ Turnover 1 - Mistakes were made when
recording prices, source
documents or in books.
- Strong competition caused
prices to drop.
- Suppliers have increased
their prices.
Operating profit on Operating profit 100 This percentage tests the cost
×
sales Sales /Turnover 1 control of the business – the