Chemical Equilibrium
Reversible and Irreversible Referred 2 as reverse reaction.
Reactions Initially RATE of reverse reaction = 0
simply bcz no HI has formed yet.
Irreversible:
Only occur in 1 direction. As HI = formed rate of reverse
Ect sulphuric acid dehydrates sugar to reaction incr.
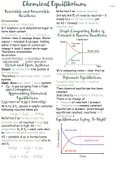
form black carbon: Graph Comparing Rates of
C12H22O11 (s) → 12 C (s) + 11 H2O (l) Forward & Reverse Reactions
Carbon rises in sausage shape. Water
vapour = released & escapes. Adding
water 2 black mass of carbon not
change it back 2 sweet white sugar.
Therefore irreversible.
Reversible:
CuSO4.5H2O(s) ⇌ CuSO4(s) 5H2O(l)
(pale blue solid) (“dirty” white solid)
Closed and Open Systems
Closed: no interaction btw system & W/e comparing rates = clear that as
surroundings. time progresses rates converges.
Therefore no mass may enter / leave
Dynamic Equilibrium
system.
Open: Mass may enter / leave system. Forward reaction rate = reverse
▪ Eg. A gas escaping from a flask reaction rate.
open 2 atmosphere. Then chemical equilibrium has been
reached.
Approaching Chemical Indicated by Reactants ⇋ Products.
Equilibrium There is no change of:
I2(g) react w/ H2(g) 2 form HI(g) ▪ Amount of reactant / product.
W/e H2 & I2 placed in empty container ▪ Temperature remains constant
following reaction takes plc: Equilibrium is dynamic. (even though
H2(g) + I2(g) → 2HI(g) equilibrium reached, reactions still
taking place.)
Referred 2 as forward reaction.
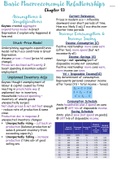
Equilibriums Lying ‘To Right’
Initially rate of reaction = high bcz
concentration is high. As time
progresses H2 & I2 = used, conc decr
so rate of forward reaction decr.
HI = unstable & as is formed some
immediately decomposes back into H2
and I2
2HI(g) → I2(g) + H2(g)
or
I2(g) + H2(g) ← 2HI(g)
, Equilibriums Lying ‘To Left’ Kc – Expression
For an equilibrium reaction:
aA + bB ⇌ cC + dD
Where:
Kc : equilibrium constant (no unit)
Each graph shows process reaching [Substance]: conc of reactant / prod
equilibrium in sections w/h lines = (in mol⋅dm-3)
sloping, & equilibrium that has been a,b,c,d : # of moles of each compound
reached in sections w/h the lines are in balanced reaction equation.
not sloping. Value of Kc
Compare parts of each graph w/h Economic viability of industrial process
equilibrium already reached. in chemical industry depends on
1st graph refers 2 equilibrium which manufacturing costs, product yield &
lies 2 right, & 2nd lies 2 left. retail cost.
▪ W/e lies to the right, conc of Factors determine profit co make.
products = high, relative 2 Kc values used 2 determine if possible
reactants, @ equilibrium. Each conc yield @ specific temp = low / high.
does not change over time since
rates of forward & reverse Kc is small Kc is large
(Kc < 1) (Kc > 1)
reactions are =, i.e. the system is in
equilibrium. Equilibrium conc of Equilibrium conc of
▪ W/e lies 2 left, conc of reactants = prods = low comp 2 prods = high comp 2
high, relative 2 products, @ reactants. reactants.
equilibrium. Since system in Product yield = low Product yield = high
equilibrium, each conc not change
over time (rates of forward & Industrial process Industrial process
reverse reaction =) not economically may be
Although each system’s forward & viable. economically viable.
reverse reaction rates are = @ Kc-Issues
equilibrium, not same rate as 4 other
Only use if system in equilibrium.
equilibrium setup.
Kc unit changes – no unit written.
4 1st setup equilibrium reaction rates =
Kc only constant if temp constant.
high. 4 2nd setup equilibrium reaction
Relates 2 conc - only gasses and
rates = lower.
solutions appear. (Solids & pure liquids
Equilibrium Constant (Kc) not have concentration!)
Kc = # that represents extent of how Conc of solids & pure liquids = 1.
reactants hv converted 2 products by Kc relates prods 2 reactants .
time chemical equilibrium = reached. Kc big – Lots prod, little reactants –
productive & Kc small – Lots reacts,
little prods – unproductive.
Reversible and Irreversible Referred 2 as reverse reaction.
Reactions Initially RATE of reverse reaction = 0
simply bcz no HI has formed yet.
Irreversible:
Only occur in 1 direction. As HI = formed rate of reverse
Ect sulphuric acid dehydrates sugar to reaction incr.
form black carbon: Graph Comparing Rates of
C12H22O11 (s) → 12 C (s) + 11 H2O (l) Forward & Reverse Reactions
Carbon rises in sausage shape. Water
vapour = released & escapes. Adding
water 2 black mass of carbon not
change it back 2 sweet white sugar.
Therefore irreversible.
Reversible:
CuSO4.5H2O(s) ⇌ CuSO4(s) 5H2O(l)
(pale blue solid) (“dirty” white solid)
Closed and Open Systems
Closed: no interaction btw system & W/e comparing rates = clear that as
surroundings. time progresses rates converges.
Therefore no mass may enter / leave
Dynamic Equilibrium
system.
Open: Mass may enter / leave system. Forward reaction rate = reverse
▪ Eg. A gas escaping from a flask reaction rate.
open 2 atmosphere. Then chemical equilibrium has been
reached.
Approaching Chemical Indicated by Reactants ⇋ Products.
Equilibrium There is no change of:
I2(g) react w/ H2(g) 2 form HI(g) ▪ Amount of reactant / product.
W/e H2 & I2 placed in empty container ▪ Temperature remains constant
following reaction takes plc: Equilibrium is dynamic. (even though
H2(g) + I2(g) → 2HI(g) equilibrium reached, reactions still
taking place.)
Referred 2 as forward reaction.
Equilibriums Lying ‘To Right’
Initially rate of reaction = high bcz
concentration is high. As time
progresses H2 & I2 = used, conc decr
so rate of forward reaction decr.
HI = unstable & as is formed some
immediately decomposes back into H2
and I2
2HI(g) → I2(g) + H2(g)
or
I2(g) + H2(g) ← 2HI(g)
, Equilibriums Lying ‘To Left’ Kc – Expression
For an equilibrium reaction:
aA + bB ⇌ cC + dD
Where:
Kc : equilibrium constant (no unit)
Each graph shows process reaching [Substance]: conc of reactant / prod
equilibrium in sections w/h lines = (in mol⋅dm-3)
sloping, & equilibrium that has been a,b,c,d : # of moles of each compound
reached in sections w/h the lines are in balanced reaction equation.
not sloping. Value of Kc
Compare parts of each graph w/h Economic viability of industrial process
equilibrium already reached. in chemical industry depends on
1st graph refers 2 equilibrium which manufacturing costs, product yield &
lies 2 right, & 2nd lies 2 left. retail cost.
▪ W/e lies to the right, conc of Factors determine profit co make.
products = high, relative 2 Kc values used 2 determine if possible
reactants, @ equilibrium. Each conc yield @ specific temp = low / high.
does not change over time since
rates of forward & reverse Kc is small Kc is large
(Kc < 1) (Kc > 1)
reactions are =, i.e. the system is in
equilibrium. Equilibrium conc of Equilibrium conc of
▪ W/e lies 2 left, conc of reactants = prods = low comp 2 prods = high comp 2
high, relative 2 products, @ reactants. reactants.
equilibrium. Since system in Product yield = low Product yield = high
equilibrium, each conc not change
over time (rates of forward & Industrial process Industrial process
reverse reaction =) not economically may be
Although each system’s forward & viable. economically viable.
reverse reaction rates are = @ Kc-Issues
equilibrium, not same rate as 4 other
Only use if system in equilibrium.
equilibrium setup.
Kc unit changes – no unit written.
4 1st setup equilibrium reaction rates =
Kc only constant if temp constant.
high. 4 2nd setup equilibrium reaction
Relates 2 conc - only gasses and
rates = lower.
solutions appear. (Solids & pure liquids
Equilibrium Constant (Kc) not have concentration!)
Kc = # that represents extent of how Conc of solids & pure liquids = 1.
reactants hv converted 2 products by Kc relates prods 2 reactants .
time chemical equilibrium = reached. Kc big – Lots prod, little reactants –
productive & Kc small – Lots reacts,
little prods – unproductive.