MATH225
Displaying Data
Frequency Distributions and Their Graphs
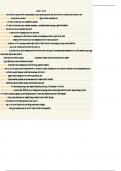
A Frequency table is a table that shows classes or
intervals of data with a count of the number of entries in each class. The
frequency of a class is the number of data entries in the class.
Cla Frequency, f
ss
1–5 5
6– 8
10
11– 6
15
16– 8
20
21– 5
25
26– 4
30
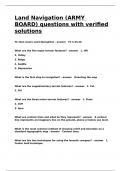
Constructing a Frequency Distribution from a Data Set
1. Decide on the number of classes to include in the
frequency distribution. (This will be given to you in
your homework).
2. Find the Class Width.
a) Find the range of the data. (highest – lowest data value)
b) Divide the range by the number of classes.
c) Round UP to the next convenient number.
3. Find the Class Limits.
a) Use the minimum data entry as the lower limit of the first class.
b) Add the class width to the lower limit to find the lower limit of
the next class.
©2024 Chamberlain 1
University
, 4. Make a tally mark for each data entry in the appropriate class.
©2024 Chamberlain University 2
Displaying Data
Frequency Distributions and Their Graphs
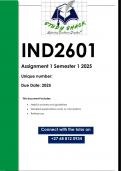
A Frequency table is a table that shows classes or
intervals of data with a count of the number of entries in each class. The
frequency of a class is the number of data entries in the class.
Cla Frequency, f
ss
1–5 5
6– 8
10
11– 6
15
16– 8
20
21– 5
25
26– 4
30
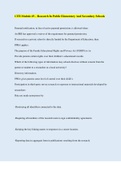
Constructing a Frequency Distribution from a Data Set
1. Decide on the number of classes to include in the
frequency distribution. (This will be given to you in
your homework).
2. Find the Class Width.
a) Find the range of the data. (highest – lowest data value)
b) Divide the range by the number of classes.
c) Round UP to the next convenient number.
3. Find the Class Limits.
a) Use the minimum data entry as the lower limit of the first class.
b) Add the class width to the lower limit to find the lower limit of
the next class.
©2024 Chamberlain 1
University
, 4. Make a tally mark for each data entry in the appropriate class.
©2024 Chamberlain University 2