STK 113
Section A: Quantitative Statistical Techniques
Contents
Section A: Quantitative Statistical Techniques ............................................................. 1
Syllabus Theme 1: Statistics: Introductory Concepts ................................................. 2
1. 1. Statistics: a means to an end .......................................................................... 2
1.2. Various types of data ........................................................................................ 3
Syllabus theme 2: transformations of quantitative data .......................................... 5
2.1 Use of graphs to represent data ....................................................................... 5
2.2 Functions ............................................................................................................. 5
2.3 Linear transformations ........................................................................................ 6
2.4 Solving linear equality ........................................................................................ 8
2.5 Quadratic transformations of quantitative data ............................................. 8
2.6 Exponential transformations of quantitative data ........................................ 11
2.7 Hyperbolic transformation of Quantitative data........................................... 12
2.8 Logarithmic transformations ............................................................................ 14
2.9 Systems of equations in equilibrium ................................................................ 17
Syllabus Theme 3: Additional concepts relating to data processing .................... 18
3.1 Special Concepts............................................................................................. 19
3.2 Sequences and series ...................................................................................... 20
3.3 Absolute values and inequalities .................................................................... 23
Section B: Descriptive statistics & Introduction to probability .................................... 26
Syllabus Theme 1: Descriptive Statistics.................................................................... 26
1.1 Data and Statistics ........................................................................................... 26
1.2 Tabular an graphical displays ......................................................................... 28
1.3 Numerical Measures ........................................................................................ 32
Syllabus Theme 2: Probability .................................................................................... 38
2.1 Introduction to probability ............................................................................... 38
By Tanya Hacke:
,Syllabus Theme 1: Statistics: Introductory Concepts
1. 1. STATISTICS: A MEANS TO AN END
What is The science of collecting analysing and understanding data
statistics?
Data:
Facts, figures collected, analysed and summarised
Values stored in data sets
Data set:
All data collected for particular study
Tables containing data
Role of Weather forecasts
statistics Medical research
Political campaigns
Tracking sales
Stock market
Quality testing
Census
Used in Economics
subject Marketing
fields: Epidemiology
Medical sciences
Demography
Education
Agriculture
Insurance
Engineering
Industry
Politics
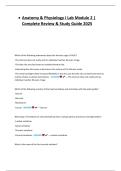
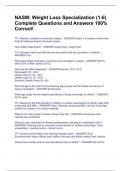
Research 1. Planning
process Formulate objectives
Purpose of study
Design questionnaire
Design suitable sampling method
2. Data collection
Plan fieldwork
Time depends on:
o Nature of investigation
o Funds
o Research assistance
3. Editing and coding
Must edit all data
Errors:
o Human errors
o Data of dubious nature
By Tanya Hacke:
, o Use of suitable statistical software
4. Analysis
Use Statistical techniques:
1. Descriptive statistics:
o Ordering data using tabulation/graphics/descriptive measures
o There are inherent traits/ Properties emerge clearly
2. Statistical Inference:
o Draw a conclusion about population
o Using descriptive measures
5. Conclusions
Put conclusions into report
Interpreting results are important
Say when you cannot answer a question
Leads to new survey
Planning
Data
Conclusion
Collection
Editing
Analysis and
coding
1.2. VARIOUS TYPES OF DATA
Terminology Elements:
Entities on which data are collected
E.g. students
Variable:
Type of info you want to collect
Characteristic of interest for elements
E.g. height
Observation:
All the data on one element
Set of measurements for particular element
Quantitative data:
By Tanya Hacke:
, Numerical data
Numbers/amounts
Continuous/ Discrete
E.g. Height
Qualitative:
Categorical data
Classifying things
Ordinal/ Nominal
E.g. Gender
Nominal data:
No order in categories
Label to identify an attribute of an element
E.g. Gender
Ordinal data:
Order/Rank of data is meaningful
Rating a product
Interval:
Expressed in terms of a fixed unit of measure
E.g. Temperature/ sea level
Zero means freezing point
Ratio:
Ratio of 2 values are meaningful
E.g. salary/ distance
Zero means nothing
Cross-sectional data:
Data collected at same point in time
E.g. “Permits issued in June 2000”
Time series data:
Collected over several time periods
E.g. “Permits issued over 36 months”
Laws of Associative:
addition/ Addition:
multiplication a + (b + c) = (a + b) + c
Multiplication:
a(bc) = (ab)c
Commutative:
Addition:
a+b=b+a
Multiplication:
ab = ba
Distributive
a(b+c) = ab +ac
By Tanya Hacke:
Section A: Quantitative Statistical Techniques
Contents
Section A: Quantitative Statistical Techniques ............................................................. 1
Syllabus Theme 1: Statistics: Introductory Concepts ................................................. 2
1. 1. Statistics: a means to an end .......................................................................... 2
1.2. Various types of data ........................................................................................ 3
Syllabus theme 2: transformations of quantitative data .......................................... 5
2.1 Use of graphs to represent data ....................................................................... 5
2.2 Functions ............................................................................................................. 5
2.3 Linear transformations ........................................................................................ 6
2.4 Solving linear equality ........................................................................................ 8
2.5 Quadratic transformations of quantitative data ............................................. 8
2.6 Exponential transformations of quantitative data ........................................ 11
2.7 Hyperbolic transformation of Quantitative data........................................... 12
2.8 Logarithmic transformations ............................................................................ 14
2.9 Systems of equations in equilibrium ................................................................ 17
Syllabus Theme 3: Additional concepts relating to data processing .................... 18
3.1 Special Concepts............................................................................................. 19
3.2 Sequences and series ...................................................................................... 20
3.3 Absolute values and inequalities .................................................................... 23
Section B: Descriptive statistics & Introduction to probability .................................... 26
Syllabus Theme 1: Descriptive Statistics.................................................................... 26
1.1 Data and Statistics ........................................................................................... 26
1.2 Tabular an graphical displays ......................................................................... 28
1.3 Numerical Measures ........................................................................................ 32
Syllabus Theme 2: Probability .................................................................................... 38
2.1 Introduction to probability ............................................................................... 38
By Tanya Hacke:
,Syllabus Theme 1: Statistics: Introductory Concepts
1. 1. STATISTICS: A MEANS TO AN END
What is The science of collecting analysing and understanding data
statistics?
Data:
Facts, figures collected, analysed and summarised
Values stored in data sets
Data set:
All data collected for particular study
Tables containing data
Role of Weather forecasts
statistics Medical research
Political campaigns
Tracking sales
Stock market
Quality testing
Census
Used in Economics
subject Marketing
fields: Epidemiology
Medical sciences
Demography
Education
Agriculture
Insurance
Engineering
Industry
Politics
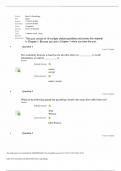
Research 1. Planning
process Formulate objectives
Purpose of study
Design questionnaire
Design suitable sampling method
2. Data collection
Plan fieldwork
Time depends on:
o Nature of investigation
o Funds
o Research assistance
3. Editing and coding
Must edit all data
Errors:
o Human errors
o Data of dubious nature
By Tanya Hacke:
, o Use of suitable statistical software
4. Analysis
Use Statistical techniques:
1. Descriptive statistics:
o Ordering data using tabulation/graphics/descriptive measures
o There are inherent traits/ Properties emerge clearly
2. Statistical Inference:
o Draw a conclusion about population
o Using descriptive measures
5. Conclusions
Put conclusions into report
Interpreting results are important
Say when you cannot answer a question
Leads to new survey
Planning
Data
Conclusion
Collection
Editing
Analysis and
coding
1.2. VARIOUS TYPES OF DATA
Terminology Elements:
Entities on which data are collected
E.g. students
Variable:
Type of info you want to collect
Characteristic of interest for elements
E.g. height
Observation:
All the data on one element
Set of measurements for particular element
Quantitative data:
By Tanya Hacke:
, Numerical data
Numbers/amounts
Continuous/ Discrete
E.g. Height
Qualitative:
Categorical data
Classifying things
Ordinal/ Nominal
E.g. Gender
Nominal data:
No order in categories
Label to identify an attribute of an element
E.g. Gender
Ordinal data:
Order/Rank of data is meaningful
Rating a product
Interval:
Expressed in terms of a fixed unit of measure
E.g. Temperature/ sea level
Zero means freezing point
Ratio:
Ratio of 2 values are meaningful
E.g. salary/ distance
Zero means nothing
Cross-sectional data:
Data collected at same point in time
E.g. “Permits issued in June 2000”
Time series data:
Collected over several time periods
E.g. “Permits issued over 36 months”
Laws of Associative:
addition/ Addition:
multiplication a + (b + c) = (a + b) + c
Multiplication:
a(bc) = (ab)c
Commutative:
Addition:
a+b=b+a
Multiplication:
ab = ba
Distributive
a(b+c) = ab +ac
By Tanya Hacke: