ONLYSTUDENTS STORE 2025 ALL THE BEST
MODULE 1 Ratios – Liquidity ratios demonstrate a company's ability to pay its debts and characteristics. We find the bond's price using Excel's PV function = PV(rate, Nper, Pmt, FV, = expected dividend yield + expected growth rate, or capital gains yield
other liabilities. Asset mgmt ratios demonstrate a company's efficiency in operations. type) NPER=Years to Maturity; Coupon rate – given; PMT = Annual Payment = Par Valuing Nonconstant Growth Stocks
Leverage, or solvency/ debt mgmt ratios demonstrate a company's ability to pay its long-term Value*Coupon rate; FV = Par/face value =stated face value of the bond; RATE =Required rate, Horizon Date: when growth rate becomes constant
debt. Performance/profitability ratios tell investors about a company's profit, which explains rd. Semi-annual coupon bond price - Since most bonds pay interest semiannually, we now Horizon Value: the PV at the horizon date of all expected future dividends
why they are frequently referred to as profitability ratios. Market valuation ratios - Since look at the valuation of semiannual bonds (virtually all bonds pay interest semi/stocks pay Horizon Value = P̂N = DN+1/( rs – g)
valuation ratios rely on a company's current share price, they provide a picture of whether or dividends quarterly). We must make three modifications to our original valuation model: (1) The stock’s intrinsic value today, P̂0, is the present value of the dividends during the
not the stock makes a compelling investment at current levels. Current ratio = current divide the coupon payment by 2, (2) multiply the years to maturity by 2, and (3) divide the nonconstant growth period plus the present value of the horizon value:
assets /current liabilities; quick/acid test ratio (cash + marketable securities + accounts nominal interest rate by 2. Yield To Maturity YTM: The YTM is the rate of return that a bond
receivable) /current liabilities OR (current assets – inventories)/current liabilities; Inventory earns if the issuer makes all scheduled payments and the bond is held to maturity. The YTM
turnover = cost of goods sold/inventory; Average collection period AKA Days Sales can also be interpreted as the "promised rate of return," or the return to investors if all
Outstanding DSO = receivables/average daily sales = receivables/(sales/365); Fixed assets promised payments are made. The YTM for a bond that sells at par consists entirely of an
turnover = Sales/net fixed assets; Total asset turnover = sales/total assets; Long-term debt interest yield. However, if the bond sells at any price other than its par value, the YTM
ratio AKA Total Debt Ratio = long-term (total) debt/ (long-term debt + equity); Total debt ratio consists of the interest yield together with a positive or negative capital gains yield. Use the
= total liabilities/total assets; Debt-equity ratio = (long-term debt + value of leases)/ equity = Rate function to solve the problem. Proceed as above with the PV function, except select
(total debt/equity); Times interest earned TIE= EBIT/ interest expense; EBITDA Coverage = =RATE(Nper,pmt, pv, -fv, type, guess) type and guess left blank. Show the current price as a
(EBITDA + lease payments)/(interest + Principle pmts + lease pmts); Operating Margin = negative – you pay this amount. Current price = FV. Yield to Call YTC - The YTC is the rate of Corporate Valuation Model: a valuation model used as an alternative to the discounted
EBIT/Sales; Profit Margin = Net Income/Sales; Return on Total Assets (ROA) = Net return investors will receive if their bonds are called. If the issuer has the right to call the dividend model to determine a firms value, especially one with no dividends, or the value of
Income/Total Assets; Return on Common Equity ROE = Net Income/Common Equity; Return bonds, and if interest rates fall, then it would be logical for the issuer to call the bonds and a single division within a larger firm.
on Invested Capital ROIC = EBIT(1-T)/Total invested capital = EBIT(1-T)/Debt + Equity; Basic replace them with new bonds that carry a lower coupon. The YTC is found similarly to the
Earnings Power BEP = EBIT/Total Assets; Price/Earnings P/E = Price Per Share/Earnings Per YTM. The same formula is used, but years to maturity is replaced with years to call, and the
Share; Book Value per Share = Common Equity/Shares Outstanding; Market/Book (M/B) = maturity is repla value (FV) replaced with the call price. Current Yield - The current yield is
Market price per share/Book Value per share; EV/EBITDA = [MV equity + MV total Debt + MV the annual interest payment divided by the bond's current price. The current yield provides
other financial claims - cash and equivalents]/EBITDA; Net Operating Profits After Taxes information regarding the amount of cash income that a bond will generate in a given year.
NOPAT = EBIT (1-T); EBIT = Sales – Operating costs Expected capital gains yield can be found as the difference between YTM and the current Some companies may also add “Market value of company’s non-operating assets” to this
yield - CGY = YTM – CY equation. For example, Apple’s cash savings.
in Cash = CF from Ops Pure Expectations Theory: states shape of the yield curve depends on investors’ expectations MODULE 5 – CAPITAL BUDGETING & PROJECT VALUATION
+ CF from Inv + CF from about future interest rates / If interest rates are expected to increase, LT rates will be higher rd = before-tax interest on new debt. Remember to use YTM, not coupon rate!
Fin than ST rates, and vice versa (curve can slope up/down/or bow). *ASSUMPTIONS: MRP for T- rd(1-T) = after-tax cost of debt. We use this for the WACC because debt interest payments are
Operations = NI + Dep + IncSinec is 0 / LT rates are an avg of current and future ST rates / If PEH is correct, you can use tax deductible.
Inc in AR and Inv yield curve to “back out” expected future interest rates. Ex) Year Forward Rate: If PEH holds, rp = component cost of preferred stock, found as the yield investors expect to earn on the
Free Cash Flow = what does market expect will be the IR on 1-yr securities, 1 yr from now? 3-yr securities, 2 yrs preferred stock.
[EBIT(1-T) + Dep + from now? One-year Treasury securities yield 4.85%. The market anticipates that 1 year from rs = component cost of common equity raised by retained earnings (not by issuing new stock)
Amortization] – [Cap now, 1-year Treasury securities will yield 5.2%. If the pure expectations theory is correct, re = component cost of external equity (issuing new stock). This will be higher because of
expenditures + in Net what is the yield today for 2-year Treasury securities? flotation costs
Op Cap] rT1 = 4.85%; 1rT1 = 5.2%; rT2 = ? wd, wp, wc = target weights of debt, preferred stock, and common equity (both internal and
FCF = EBIT(1 – T) + Deprec. – CapEx – NOWC (1 + rT2)2 = (1.0485)(1.052) external)
Total operating capital = NET Fixed Assets + NOWC / Net FA = gross FA – accum. dep The value (1 + rT2)2 = 1.103022
EVA=(EBIT)(1-T) – (Total Inv Capital)(After Tax % Cost of Capital) OR EVA = (EBIT)(1-T) – (Total of any 1 + rT2 = 1.05024854
Inv Capital)(WACC) financial rT2 = 5.02%.
NOWC = Operating current assets – Operating current liabilities OR NOWC = (Current assets – *CONCLUSIONS: PEH is useful starting point, some argue MRP =/= 0 so PEH is incorrect / Mo
Excess cash) − (Current liabilities – Notes payable); EV/EBITDA = (MVEquity + MVTotal Debt + evidence supports general view that lenders prefer S-T Sec. and view L-T Sec. as riskier, so
MVOther Claims – Cash and Equivalents)/EBITDA investors demand a premium to persuade to hold L-T (MRP > 0)
DuPont Eq (Shows the relationship among asset management, debt management, and MODULE 3 CONTINUED - Bonds and Valuation
profitability ratios) (profit margin)(TA turnover)(EqMult or EM) = ROE (EM = TA/CE) Par Value: The face value of a bond
Market Value Added – diff between market value of firm’s equity and BV as shown in bal Coupon Payment: the specified number of dollars of interest paid each year
sheet MVA = stock price x # of shares o/s – BV of ComEq (ending bal on total SE) Zero Coupon Bond: bonds that pay not annual interest payments, just one final payment at
MODULE 2 – TIME VALUE OF MONEY maturity.
PMT is the payment made each period; it cannot change over the life of the annuity. Pmt Discount Bond: a bond that sells below it’s par value; occurs whenever the going rate of inter
must be entered as a negative number. PV is the present value, or the lump-sum amount that is above the coupon rate
a series of future payments is worth right now. If pv is omitted, it is assumed to be 0 (zero). Premium Bond: a bond that sells above it’s par value
PV must be entered as a negative number. Type is the number 0 or 1 and indicates when What is the price of the bond i.e. it’s fair market value?
payments are due. If type is omitted, it is assumed to be 0 which represents at the end of the Excel f(x) =PV(int rate, years to maturity, pmt, FV, type)
period. If payments are due at the beginning of the period, type should be 1 (BEGIN). What is the price of Semi-Annual Bond?
PV(rate,nper,pmt,fv,type) ; RATE is the interest rate per period. For example, if you obtain an Excel f(x) =PV(int rate/2, years to maturity*2, pmt/2, FV, type)
automobile loan at a 10 percent annual interest rate and make monthly payments, your Duration: the weighted average of the time it takes to receive each of the bond’s cash flows.
interest rate per month is 10%/12, or 0.83%. You would enter 10%/12, or 0.83%, or 0.0083, *Duration of a Zero Coupon Bond = its maturity
into the formula as the rate. FV is the future value, or a cash balance you want to attain after Duration Example: you have a bond with $1000 face value with a 6% coupon rate and 3 years
the last payment is made. FV must be entered as a negative amount. Finding the FV of CF is remaining to maturity. Current market rate is 7%. Find the Duration.
called compounding / Finding the PV of CFs is reverse, discounting. First find PV of bond:
Find Future Values: Excel f(x) =FV(int rate, no of periods, pmt, PV) PMT = 60, FV = 1000, I/YR = 6, N = 3, ➔ PV = -973.76
Find Present Values: Excel f(x) =PV(int rate, no of periods, pmt, FV) Now enter cash flows in cash flow register. The values we enter are CF * T (time period). So,
Find the Interest Rate: Excel f(x) =RATE(no of yrs, pmt, PV, FV, type, guess) T0 we enter 0, T1 we enter (60*1) = 60, for T2 we enter (60 *2) = 120, and for T3 we enter ((6
Find the Number of Years: Excel f(x) =NPER(int rate, pmt, PV, FV, type) 1000)*3) = 3180.
Annuity: a series of equal payments at fixed intervals for a specified number of periods. Finally we enter I/YR = 7 and we hit 2nd + NPV to find the NPV. The duration is NPV/PV = 2.83
Ordinary (Deferred) Annuity: An annuity whose payments occur at the end of each period. years.
Find Future Value of an Ordinary Annuity: Excel f(x) =FV(int rate, no of periods, pmt, 0, MODULE 4 – RISK, RETURN & STOCK VALUATION
type0)Find Present Value of an Ordinary Annuity: Excel f(x) =PV(int rate, no of periods, pmt, When two stocks are perfectly negatively correlated, diversification is its strongest.
0,type0) [NPER is the total number of payment periods in an annuity. – For example, if you Assumptions: 1) all else equal, investors like higher rates of return 2) average investor likes ris
get a four-year car loan and make monthly payments, your loan has 4*12 (or 48) periods. You Beta Coefficient b: a metric that shows the extent to which a given stock’s returns move up an
would enter 48 into the formula for nper] down with the stock market. Beta measures market risk.
Annuity Due: an annuity whose payments occur at the beginning of each period bi = (Pi, Mu, sdi) / sdMu If beta = 1.0, the security is just as risky as average stock. If beta > 1
Find Future Value of an Annuity Due: Excel f(x) =FV(int rate, no of periods, pmt, 0, type1) the security is riskier than the avg stock. If beta < 1.0, security is less risky than avg (most
More Annuities stocks have betas in the range of 0.5 to 1.5)
Find Annuity Payments, PMT : Excel f(x) =PMT(int rate, no of periods, PV, FV, type0)END / rî = expected rate of return on the ith stock.
Excel f(x) =PMT(int rate, no of periods, PV, FV, type1)BEGIN ri = required rate of return on the ith stock. Note that if rî is less than ri, the typical investor w
Find the Number of Periods: Excel f(x) =NPER(int rate, pmt, PV, FV, type0)END / Excel f(x) not purchase this stock or will sell it if he owns it. If the opposite is true, the investor will buy i
=NPER(int rate, pmt, PV, FV, type1)BEGIN thinking it is a bargain.
Find the Interest Rate: Excel f(x) =RATE(no of yrs, pmt, PV, FV, type0, guess)END / Excel f(x) r̅i = realized, after-the-fact return.
=RATE(no of yrs, pmt, PV, FV, type1, guess)BEGIN rRF = risk-free rate of return. Usually gotten from US Treasury bills.
Perpetuity: a stream of equal payments at fixed intervals expected to continue forever rM = required rate of return on a portfolio consisting of all stocks, which is called the market
Find PV of a Perpetuity: PV = PMT / Interest Rate portfolio.
Uneven Cash Flows RPM = (rM - rRF) = risk premium on “ the market” and the premium on an average stock. This is
Find PV of Uneven Cash Flow Stream (NPV): Excel f(x) =NPV(int rate, value1, value2, value3…) additional return over the risk-free rate required to compensate an average investor for
/ Excel f(x) =PV(int rate, no of periods, pmt, FV,type0) assuming an average amount of risk.
Find FV of Uneven Cash Flow Streams (NFV): Step 1: Excel f(x) =NPV(int rate, value1, value2, Risk premium on the ith stock RPi = (rM - rRF)bi
value3…) Step 2: Excel f(x) =-FV(int rate, no of periods,, NPV) CAPM formula r = rRF + (rM - rRF)bi
SML: ri = rRF + RPm X bi
The SML shows the relationship between the stock's beta and its required return, as predicted
by the CAPM
Excel f(x) =EFFECT(nominal_rate, no of periods per year) – Using the Excel function, if the Dividend Growth Model – value of a stock is the PV of the future dividends expected to be
nominal rate is 10% with semiannual compounding, the effective annual rate is: Nominal rate generated by the stock
= 10% Periods per year = 2 P0 = D1 / (1 + rs )^1 + D2 / (1 + rs )^2 … Dinfinity / (1 + rs )^infinity
Effective rate: 10.25% =EFFECT(nominal_rate,npery) Constant Growth Stock – stock whose dividends are expected to grow forever at a constant ra
Using formula: 10.25% =(1+C470/C471)^C471‒1 g (can use to find stock’s intrinsic value)
Intrinsic value: an estimate of stock’s “true” value based on accurate risk and return data (can be estimated but not
D1 = D0 (1 + g)^1D2
measured precisely) / Market Price: The stock value based on perceived but possibly incorrect info as seen by = D0 (1 + g)^2
marginal investor (investor whose views determine actual price). Equilibrium: actual market price = intrinsic value, so Dt = D0 (1 + g)^t
investors are indiff. Between buying & selling. If g is constant, dividend growth formula converges to:
P0 = D0 (1 + g) / rs – g = D1 / rs – g
MODULE 3 – INTEREST RATES & BONDS
Dt = the dividend a stockholder expects to receive at the end of each year T. D0 is the last
In an effort to simplify the composition of interest rates, we will look at nominal interest rates
dividend the company paid.
being composed of five driving forces, as outlined here: Nominal interest rate = r = r* + IP +
P0 = actual market price of the stock today.
DRP + LP + MRP. Here r* represents the real risk-free rate of interest, IP is the inflation
Pt̂ = both the expected price and the expected intrinsic value of the stock at the end of each
premium, DRP is the default risk premium, LP is the liquidity premium, and MRP is the
Year t.
maturity risk premium. Together, these five factors determine the nominal interest rate,
denoted by r. Quoted rate on a risk free security = RRF = R* + IP g = expected growth rate in dividends
rs = required rate of return on the stock considering its riskiness and the returns available on
other investments
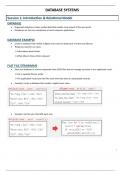
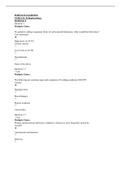
InterestRate Short-Term Long-Term Short-Term Long-Term Bonds and
Parameter Treasuries Treasuries Corporates Corporates rŝ = expected rate of return that an investor believes the stock will provide in the future
their
r* X X X X r̅s = actual, or realized rate of return
evaluation:
IP X X X X
ONLYSTUDENTS STORE MRP X X DO NOT COPY
1
DRP X X
T his study source was downloXaded by X10000
LP
1
MODULE 1 Ratios – Liquidity ratios demonstrate a company's ability to pay its debts and characteristics. We find the bond's price using Excel's PV function = PV(rate, Nper, Pmt, FV, = expected dividend yield + expected growth rate, or capital gains yield
other liabilities. Asset mgmt ratios demonstrate a company's efficiency in operations. type) NPER=Years to Maturity; Coupon rate – given; PMT = Annual Payment = Par Valuing Nonconstant Growth Stocks
Leverage, or solvency/ debt mgmt ratios demonstrate a company's ability to pay its long-term Value*Coupon rate; FV = Par/face value =stated face value of the bond; RATE =Required rate, Horizon Date: when growth rate becomes constant
debt. Performance/profitability ratios tell investors about a company's profit, which explains rd. Semi-annual coupon bond price - Since most bonds pay interest semiannually, we now Horizon Value: the PV at the horizon date of all expected future dividends
why they are frequently referred to as profitability ratios. Market valuation ratios - Since look at the valuation of semiannual bonds (virtually all bonds pay interest semi/stocks pay Horizon Value = P̂N = DN+1/( rs – g)
valuation ratios rely on a company's current share price, they provide a picture of whether or dividends quarterly). We must make three modifications to our original valuation model: (1) The stock’s intrinsic value today, P̂0, is the present value of the dividends during the
not the stock makes a compelling investment at current levels. Current ratio = current divide the coupon payment by 2, (2) multiply the years to maturity by 2, and (3) divide the nonconstant growth period plus the present value of the horizon value:
assets /current liabilities; quick/acid test ratio (cash + marketable securities + accounts nominal interest rate by 2. Yield To Maturity YTM: The YTM is the rate of return that a bond
receivable) /current liabilities OR (current assets – inventories)/current liabilities; Inventory earns if the issuer makes all scheduled payments and the bond is held to maturity. The YTM
turnover = cost of goods sold/inventory; Average collection period AKA Days Sales can also be interpreted as the "promised rate of return," or the return to investors if all
Outstanding DSO = receivables/average daily sales = receivables/(sales/365); Fixed assets promised payments are made. The YTM for a bond that sells at par consists entirely of an
turnover = Sales/net fixed assets; Total asset turnover = sales/total assets; Long-term debt interest yield. However, if the bond sells at any price other than its par value, the YTM
ratio AKA Total Debt Ratio = long-term (total) debt/ (long-term debt + equity); Total debt ratio consists of the interest yield together with a positive or negative capital gains yield. Use the
= total liabilities/total assets; Debt-equity ratio = (long-term debt + value of leases)/ equity = Rate function to solve the problem. Proceed as above with the PV function, except select
(total debt/equity); Times interest earned TIE= EBIT/ interest expense; EBITDA Coverage = =RATE(Nper,pmt, pv, -fv, type, guess) type and guess left blank. Show the current price as a
(EBITDA + lease payments)/(interest + Principle pmts + lease pmts); Operating Margin = negative – you pay this amount. Current price = FV. Yield to Call YTC - The YTC is the rate of Corporate Valuation Model: a valuation model used as an alternative to the discounted
EBIT/Sales; Profit Margin = Net Income/Sales; Return on Total Assets (ROA) = Net return investors will receive if their bonds are called. If the issuer has the right to call the dividend model to determine a firms value, especially one with no dividends, or the value of
Income/Total Assets; Return on Common Equity ROE = Net Income/Common Equity; Return bonds, and if interest rates fall, then it would be logical for the issuer to call the bonds and a single division within a larger firm.
on Invested Capital ROIC = EBIT(1-T)/Total invested capital = EBIT(1-T)/Debt + Equity; Basic replace them with new bonds that carry a lower coupon. The YTC is found similarly to the
Earnings Power BEP = EBIT/Total Assets; Price/Earnings P/E = Price Per Share/Earnings Per YTM. The same formula is used, but years to maturity is replaced with years to call, and the
Share; Book Value per Share = Common Equity/Shares Outstanding; Market/Book (M/B) = maturity is repla value (FV) replaced with the call price. Current Yield - The current yield is
Market price per share/Book Value per share; EV/EBITDA = [MV equity + MV total Debt + MV the annual interest payment divided by the bond's current price. The current yield provides
other financial claims - cash and equivalents]/EBITDA; Net Operating Profits After Taxes information regarding the amount of cash income that a bond will generate in a given year.
NOPAT = EBIT (1-T); EBIT = Sales – Operating costs Expected capital gains yield can be found as the difference between YTM and the current Some companies may also add “Market value of company’s non-operating assets” to this
yield - CGY = YTM – CY equation. For example, Apple’s cash savings.
in Cash = CF from Ops Pure Expectations Theory: states shape of the yield curve depends on investors’ expectations MODULE 5 – CAPITAL BUDGETING & PROJECT VALUATION
+ CF from Inv + CF from about future interest rates / If interest rates are expected to increase, LT rates will be higher rd = before-tax interest on new debt. Remember to use YTM, not coupon rate!
Fin than ST rates, and vice versa (curve can slope up/down/or bow). *ASSUMPTIONS: MRP for T- rd(1-T) = after-tax cost of debt. We use this for the WACC because debt interest payments are
Operations = NI + Dep + IncSinec is 0 / LT rates are an avg of current and future ST rates / If PEH is correct, you can use tax deductible.
Inc in AR and Inv yield curve to “back out” expected future interest rates. Ex) Year Forward Rate: If PEH holds, rp = component cost of preferred stock, found as the yield investors expect to earn on the
Free Cash Flow = what does market expect will be the IR on 1-yr securities, 1 yr from now? 3-yr securities, 2 yrs preferred stock.
[EBIT(1-T) + Dep + from now? One-year Treasury securities yield 4.85%. The market anticipates that 1 year from rs = component cost of common equity raised by retained earnings (not by issuing new stock)
Amortization] – [Cap now, 1-year Treasury securities will yield 5.2%. If the pure expectations theory is correct, re = component cost of external equity (issuing new stock). This will be higher because of
expenditures + in Net what is the yield today for 2-year Treasury securities? flotation costs
Op Cap] rT1 = 4.85%; 1rT1 = 5.2%; rT2 = ? wd, wp, wc = target weights of debt, preferred stock, and common equity (both internal and
FCF = EBIT(1 – T) + Deprec. – CapEx – NOWC (1 + rT2)2 = (1.0485)(1.052) external)
Total operating capital = NET Fixed Assets + NOWC / Net FA = gross FA – accum. dep The value (1 + rT2)2 = 1.103022
EVA=(EBIT)(1-T) – (Total Inv Capital)(After Tax % Cost of Capital) OR EVA = (EBIT)(1-T) – (Total of any 1 + rT2 = 1.05024854
Inv Capital)(WACC) financial rT2 = 5.02%.
NOWC = Operating current assets – Operating current liabilities OR NOWC = (Current assets – *CONCLUSIONS: PEH is useful starting point, some argue MRP =/= 0 so PEH is incorrect / Mo
Excess cash) − (Current liabilities – Notes payable); EV/EBITDA = (MVEquity + MVTotal Debt + evidence supports general view that lenders prefer S-T Sec. and view L-T Sec. as riskier, so
MVOther Claims – Cash and Equivalents)/EBITDA investors demand a premium to persuade to hold L-T (MRP > 0)
DuPont Eq (Shows the relationship among asset management, debt management, and MODULE 3 CONTINUED - Bonds and Valuation
profitability ratios) (profit margin)(TA turnover)(EqMult or EM) = ROE (EM = TA/CE) Par Value: The face value of a bond
Market Value Added – diff between market value of firm’s equity and BV as shown in bal Coupon Payment: the specified number of dollars of interest paid each year
sheet MVA = stock price x # of shares o/s – BV of ComEq (ending bal on total SE) Zero Coupon Bond: bonds that pay not annual interest payments, just one final payment at
MODULE 2 – TIME VALUE OF MONEY maturity.
PMT is the payment made each period; it cannot change over the life of the annuity. Pmt Discount Bond: a bond that sells below it’s par value; occurs whenever the going rate of inter
must be entered as a negative number. PV is the present value, or the lump-sum amount that is above the coupon rate
a series of future payments is worth right now. If pv is omitted, it is assumed to be 0 (zero). Premium Bond: a bond that sells above it’s par value
PV must be entered as a negative number. Type is the number 0 or 1 and indicates when What is the price of the bond i.e. it’s fair market value?
payments are due. If type is omitted, it is assumed to be 0 which represents at the end of the Excel f(x) =PV(int rate, years to maturity, pmt, FV, type)
period. If payments are due at the beginning of the period, type should be 1 (BEGIN). What is the price of Semi-Annual Bond?
PV(rate,nper,pmt,fv,type) ; RATE is the interest rate per period. For example, if you obtain an Excel f(x) =PV(int rate/2, years to maturity*2, pmt/2, FV, type)
automobile loan at a 10 percent annual interest rate and make monthly payments, your Duration: the weighted average of the time it takes to receive each of the bond’s cash flows.
interest rate per month is 10%/12, or 0.83%. You would enter 10%/12, or 0.83%, or 0.0083, *Duration of a Zero Coupon Bond = its maturity
into the formula as the rate. FV is the future value, or a cash balance you want to attain after Duration Example: you have a bond with $1000 face value with a 6% coupon rate and 3 years
the last payment is made. FV must be entered as a negative amount. Finding the FV of CF is remaining to maturity. Current market rate is 7%. Find the Duration.
called compounding / Finding the PV of CFs is reverse, discounting. First find PV of bond:
Find Future Values: Excel f(x) =FV(int rate, no of periods, pmt, PV) PMT = 60, FV = 1000, I/YR = 6, N = 3, ➔ PV = -973.76
Find Present Values: Excel f(x) =PV(int rate, no of periods, pmt, FV) Now enter cash flows in cash flow register. The values we enter are CF * T (time period). So,
Find the Interest Rate: Excel f(x) =RATE(no of yrs, pmt, PV, FV, type, guess) T0 we enter 0, T1 we enter (60*1) = 60, for T2 we enter (60 *2) = 120, and for T3 we enter ((6
Find the Number of Years: Excel f(x) =NPER(int rate, pmt, PV, FV, type) 1000)*3) = 3180.
Annuity: a series of equal payments at fixed intervals for a specified number of periods. Finally we enter I/YR = 7 and we hit 2nd + NPV to find the NPV. The duration is NPV/PV = 2.83
Ordinary (Deferred) Annuity: An annuity whose payments occur at the end of each period. years.
Find Future Value of an Ordinary Annuity: Excel f(x) =FV(int rate, no of periods, pmt, 0, MODULE 4 – RISK, RETURN & STOCK VALUATION
type0)Find Present Value of an Ordinary Annuity: Excel f(x) =PV(int rate, no of periods, pmt, When two stocks are perfectly negatively correlated, diversification is its strongest.
0,type0) [NPER is the total number of payment periods in an annuity. – For example, if you Assumptions: 1) all else equal, investors like higher rates of return 2) average investor likes ris
get a four-year car loan and make monthly payments, your loan has 4*12 (or 48) periods. You Beta Coefficient b: a metric that shows the extent to which a given stock’s returns move up an
would enter 48 into the formula for nper] down with the stock market. Beta measures market risk.
Annuity Due: an annuity whose payments occur at the beginning of each period bi = (Pi, Mu, sdi) / sdMu If beta = 1.0, the security is just as risky as average stock. If beta > 1
Find Future Value of an Annuity Due: Excel f(x) =FV(int rate, no of periods, pmt, 0, type1) the security is riskier than the avg stock. If beta < 1.0, security is less risky than avg (most
More Annuities stocks have betas in the range of 0.5 to 1.5)
Find Annuity Payments, PMT : Excel f(x) =PMT(int rate, no of periods, PV, FV, type0)END / rî = expected rate of return on the ith stock.
Excel f(x) =PMT(int rate, no of periods, PV, FV, type1)BEGIN ri = required rate of return on the ith stock. Note that if rî is less than ri, the typical investor w
Find the Number of Periods: Excel f(x) =NPER(int rate, pmt, PV, FV, type0)END / Excel f(x) not purchase this stock or will sell it if he owns it. If the opposite is true, the investor will buy i
=NPER(int rate, pmt, PV, FV, type1)BEGIN thinking it is a bargain.
Find the Interest Rate: Excel f(x) =RATE(no of yrs, pmt, PV, FV, type0, guess)END / Excel f(x) r̅i = realized, after-the-fact return.
=RATE(no of yrs, pmt, PV, FV, type1, guess)BEGIN rRF = risk-free rate of return. Usually gotten from US Treasury bills.
Perpetuity: a stream of equal payments at fixed intervals expected to continue forever rM = required rate of return on a portfolio consisting of all stocks, which is called the market
Find PV of a Perpetuity: PV = PMT / Interest Rate portfolio.
Uneven Cash Flows RPM = (rM - rRF) = risk premium on “ the market” and the premium on an average stock. This is
Find PV of Uneven Cash Flow Stream (NPV): Excel f(x) =NPV(int rate, value1, value2, value3…) additional return over the risk-free rate required to compensate an average investor for
/ Excel f(x) =PV(int rate, no of periods, pmt, FV,type0) assuming an average amount of risk.
Find FV of Uneven Cash Flow Streams (NFV): Step 1: Excel f(x) =NPV(int rate, value1, value2, Risk premium on the ith stock RPi = (rM - rRF)bi
value3…) Step 2: Excel f(x) =-FV(int rate, no of periods,, NPV) CAPM formula r = rRF + (rM - rRF)bi
SML: ri = rRF + RPm X bi
The SML shows the relationship between the stock's beta and its required return, as predicted
by the CAPM
Excel f(x) =EFFECT(nominal_rate, no of periods per year) – Using the Excel function, if the Dividend Growth Model – value of a stock is the PV of the future dividends expected to be
nominal rate is 10% with semiannual compounding, the effective annual rate is: Nominal rate generated by the stock
= 10% Periods per year = 2 P0 = D1 / (1 + rs )^1 + D2 / (1 + rs )^2 … Dinfinity / (1 + rs )^infinity
Effective rate: 10.25% =EFFECT(nominal_rate,npery) Constant Growth Stock – stock whose dividends are expected to grow forever at a constant ra
Using formula: 10.25% =(1+C470/C471)^C471‒1 g (can use to find stock’s intrinsic value)
Intrinsic value: an estimate of stock’s “true” value based on accurate risk and return data (can be estimated but not
D1 = D0 (1 + g)^1D2
measured precisely) / Market Price: The stock value based on perceived but possibly incorrect info as seen by = D0 (1 + g)^2
marginal investor (investor whose views determine actual price). Equilibrium: actual market price = intrinsic value, so Dt = D0 (1 + g)^t
investors are indiff. Between buying & selling. If g is constant, dividend growth formula converges to:
P0 = D0 (1 + g) / rs – g = D1 / rs – g
MODULE 3 – INTEREST RATES & BONDS
Dt = the dividend a stockholder expects to receive at the end of each year T. D0 is the last
In an effort to simplify the composition of interest rates, we will look at nominal interest rates
dividend the company paid.
being composed of five driving forces, as outlined here: Nominal interest rate = r = r* + IP +
P0 = actual market price of the stock today.
DRP + LP + MRP. Here r* represents the real risk-free rate of interest, IP is the inflation
Pt̂ = both the expected price and the expected intrinsic value of the stock at the end of each
premium, DRP is the default risk premium, LP is the liquidity premium, and MRP is the
Year t.
maturity risk premium. Together, these five factors determine the nominal interest rate,
denoted by r. Quoted rate on a risk free security = RRF = R* + IP g = expected growth rate in dividends
rs = required rate of return on the stock considering its riskiness and the returns available on
other investments
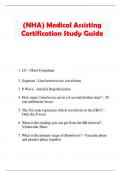
InterestRate Short-Term Long-Term Short-Term Long-Term Bonds and
Parameter Treasuries Treasuries Corporates Corporates rŝ = expected rate of return that an investor believes the stock will provide in the future
their
r* X X X X r̅s = actual, or realized rate of return
evaluation:
IP X X X X
ONLYSTUDENTS STORE MRP X X DO NOT COPY
1
DRP X X
T his study source was downloXaded by X10000
LP
1