HUG CH 2+10
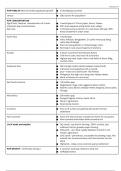
POP+HEALTH Most of world’s population growth ● In developing countries
census ● Data source for population
POP CONCENTRATION
Signif facts, features, characteristics of 4 most ● ¼ world pop in E China, Japan, Korea, Taiwan
important pop concentrations ● PRC most populous along fertile river valleys
East Asia ● ½ Chinese work as farmers in rural areas, 93% Jap+ 80%
Korea clustered in urban areas
South Asia ● ¼ world pop
● India, Pakistan, Bangladesh, Sri Lanka most pop along
Lehor-Bay of Bengal
● Pop conc along planes or Indus/Ganges rivers
● Farming in rural areas (majority of workers)
Europe ● 4 dozen countries from Monaco-Russia
● 75% live in cities, less than 5% as farmers
● Highest pop near major rivers+coal fields of Germ, Belg,
London, Paris
Southeast Asia ● 600 mill ppl mostly islands between India+Pacific
● Indonesia most populous (4th in world)
● Java = most conc island (over 100 million)
● Philippines has high conc along river valleys+deltas
● Work as farmers in rural areas
East North America ● 100 million pop
● Megalopolis: huge urban agglomerations (cities)
● Atlantic coast, Boston, Newport News (Virginia), Great Lakes,
Chicago
West Africa ● 300 million pop
● Senegal, Nigeria, Eritrea, South Africa
● Work in agriculture
● Several pop clusters
ecumene ● Area on E surface occupied by permanent human
settlement
Non ecumene ● Areas of E that humans consider too harsh for occupance
● Non-ecumene diminishes while ecumene incr
List 4 lands and explain ● Dry Lands - too dry for farming ~20% E surface, lack
sufficient h20 for growth+major farming
● WetLands - rain+heat rapidly depletes nutrient fr soil,
hinders agriculture
● Cold Lands - permafrost, unsuitable for planting crops, few
animals can survive extreme cold, few humans can live
there
● Highlands - steep, snow covered, sparse settlement
POP DENSITY = Arithmetic density = ● A country’s total pop relative to land size
● tot#objects/area
, ● High # = high pop density, low # = low pop density
Physiological density ● # ppl supported per unit area of arable land in a region
● High # = high pop to feed, low # = low pop to feed
● Arable land = land suitable for agriculture
Agricultural density ● Ratio of farmers to amount of arable land
● High # = developing country (labour intensive), low # =
developed country (increase technology use)
WORLD POP ● % by which pop grows each year
Natural rate of increase NIR ● CBR-CDR → (+)incr (-)decr
● Most of human history: essentially 0
● Peak: 2.2%
● Current: high historically but NIR is lower than 2.2%
Because world pop so large, small increases to NIR ● Can produce very large swings in pop growth
Doubling time ● #years needed to double a pop //currently 1.2%/year (54
years)
Life expectancy ● Avg num years an individual can be expected to live given
current social, econ, med conditions
● Developed: 80, developing: 57
Regions with high NIRS ● Sub-Saharan, Africa, South Asia - more births, earlier death
Low NIRS ● NA, Latin A - more deaths than births
Negative NIR ● Europe - pop decor, less babies born each year
Crude Birth Rate (CBR) ● Total # live births in a yr for every 1000 ppl alive
● High CBR: sub Saharan - less access to contraception
● Low CBR: europe - less desire for large fam
Crude Death Rate (CDR) ● Total # of deaths in a yr for every 1000 ppl alive
● High CDR: Sub-Saharan Africa, Ukraine
● Low CDR: Saudi Arabia, Libya, and Asia
Demography ● Sci/ statistical study of pop characteristics
Total fertility rate TFR ● Avg num children a woman will have throughout child
bearing years
● TFR needed to maintain same size pop: 2.1
● World TFR: 2.5, US TFR: below 2, high TFR: sub sahar, lowTFR
Eur
Demographic transitions ● Process of change in society’s pop - high birth/death low NIR
to low birth/death, low NIR but higher total pop
HEALTH AND GENDER ● Women's health affects child’s health and the size and
composition of a pop
Sex ratio ● #male:100 females
● Natural occur : 105: 100
● Not adhering: india, china
● Cause: cultural preference, gov policies to promote sm