Assignment 6A
Total Marks = 63
Please show all your work. Some questions require you to use graphs, tree
diagrams, formulas, and so on that are difficult or impossible to reproduce
in word-processing programs, so you will have to print the entire
assignment and fill it out and mail it to your tutor. As an alternative to
mailing, you might be able to photograph or scan your assignment and
submit it through the appropriate drop box. If you do, make sure the
material you are submitting is legible.
Question 1
A manufacturer of exercise bicycles is studying the relationship between the
number of months an exercise bicycle has been owned and the length of
time it was used last week. Data for a random sample of 7 owners are
provided in the table below
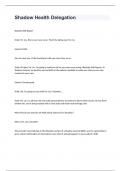
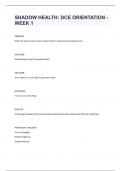
Months Owned Hours Used Last Week 1
(x) (y) ~2
"'
I~ l, 3b
'j_~
i4
14 6
(,4
, ~, :t,,o5
8 8 b~ b4
2.~
5 7
3 9 ~\
10 6 \00 °)(.
4 8 lb ~~ 32
12 7 IAA A\ i4
2x:s5e, ~~ =51 Lf =SS4 t ~1 =31~ I1r 31~
Introduction to Statistics
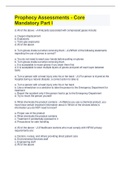
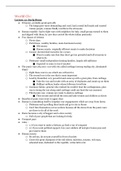
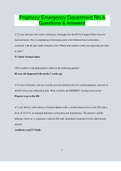
, 4 marks a. Constrnrt a scatter diagram for these data with "Months Owned" on the
horizontal ( x) axis. and ''Hours Used Last Week" on the vertical (y)
axis.
Note: Try to make relatively full use of the graph area.
,
~
-
- -~- --
•
~
~1lh \l 5 j J
l ~ S~ Wee
7
.
- •- .... - I-
r- r-- ,_
~ - _,. •,_r--
-
5
~
3
2 marks b.
-1
-4
"
S 10 rz ,1 lb
Describe the general pattern of the relationship between the two
~ J _, /'()Wiled
rnriables.
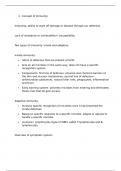
11 marks r . Calculate the least squares regression line with hours used as the
dependent variable and months owned as the independent variable.
Note: Express a and b to 4 decimal places of accuracy.
3 marks d. Plot the regression line on the scatter diagram you constructed in part
(a).
b) 0\t ~ tll't. ""ol'1 i i. 5 +~~l ~ Note: Show your calculations for x =4 and x =12 .
l,:.Kt I) owl'l d ii,t le )5 ~ 01Jr )
~~d li1~t \>Kt: ~
_5<,u -1 2
b- ~ : fol; =-0.10754717
a. " ~ - bx 77. ~1 -(-o. 1(~)" 3.14b0~/&4~
S) )( ; 4 y = t15 - o.2! (4)
~ tll51 014 6(,
K-; 17 q'.: B, 15 - o.2I (11)
:. , A~55 25 bo(,
2 Mathematics 215 / Assignment 6A
Total Marks = 63
Please show all your work. Some questions require you to use graphs, tree
diagrams, formulas, and so on that are difficult or impossible to reproduce
in word-processing programs, so you will have to print the entire
assignment and fill it out and mail it to your tutor. As an alternative to
mailing, you might be able to photograph or scan your assignment and
submit it through the appropriate drop box. If you do, make sure the
material you are submitting is legible.
Question 1
A manufacturer of exercise bicycles is studying the relationship between the
number of months an exercise bicycle has been owned and the length of
time it was used last week. Data for a random sample of 7 owners are
provided in the table below
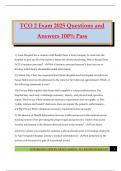
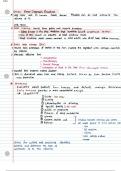
Months Owned Hours Used Last Week 1
(x) (y) ~2
"'
I~ l, 3b
'j_~
i4
14 6
(,4
, ~, :t,,o5
8 8 b~ b4
2.~
5 7
3 9 ~\
10 6 \00 °)(.
4 8 lb ~~ 32
12 7 IAA A\ i4
2x:s5e, ~~ =51 Lf =SS4 t ~1 =31~ I1r 31~
Introduction to Statistics
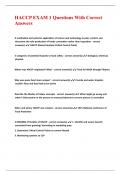
, 4 marks a. Constrnrt a scatter diagram for these data with "Months Owned" on the
horizontal ( x) axis. and ''Hours Used Last Week" on the vertical (y)
axis.
Note: Try to make relatively full use of the graph area.
,
~
-
- -~- --
•
~
~1lh \l 5 j J
l ~ S~ Wee
7
.
- •- .... - I-
r- r-- ,_
~ - _,. •,_r--
-
5
~
3
2 marks b.
-1
-4
"
S 10 rz ,1 lb
Describe the general pattern of the relationship between the two
~ J _, /'()Wiled
rnriables.
11 marks r . Calculate the least squares regression line with hours used as the
dependent variable and months owned as the independent variable.
Note: Express a and b to 4 decimal places of accuracy.
3 marks d. Plot the regression line on the scatter diagram you constructed in part
(a).
b) 0\t ~ tll't. ""ol'1 i i. 5 +~~l ~ Note: Show your calculations for x =4 and x =12 .
l,:.Kt I) owl'l d ii,t le )5 ~ 01Jr )
~~d li1~t \>Kt: ~
_5<,u -1 2
b- ~ : fol; =-0.10754717
a. " ~ - bx 77. ~1 -(-o. 1(~)" 3.14b0~/&4~
S) )( ; 4 y = t15 - o.2! (4)
~ tll51 014 6(,
K-; 17 q'.: B, 15 - o.2I (11)
:. , A~55 25 bo(,
2 Mathematics 215 / Assignment 6A