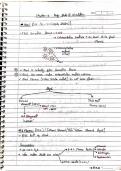
SPSS cheat sheet
Block 3
Correlations
Scatter plot: LEGACY DIALOGS > SCATTERPLOT > SIMPLE SCATTER >
select variables on X axis & Y axis
- add regression line: double click on plot > ADD FIT LINE
- add confidence/prediction interval: double click on plot >
add intervals (mean for CI or individual scores for PI)
Pearson r: ANALYZE > CORRELATE > BIVARIATE > tick “Pearson”
Spearman’s rho: ANALYZE > CORRELATE > BIVARIATE > tick “Spearman”
- for means and standard deviations: OPTIONS… > tick “Means and standard deviations”
! if they ask for r pb or phi, just use Pearson r
Regression
Regression analysis (both Simple & Multiple): ANALYZE > REGRESSION > LINEAR > select dependent &
independent variables
- STATISTICS… - for Confidence Intervals, Partial correlations
- SAVE… - for Prediction Interval, Cook’s d, Standardized Residuals, Leverage, Predicted Values
- PLOTS… - for Scatterplots (ZPRED = predicted values; ZRESID = residuals; tick “Histogram” for
histogram of standardized residuals)
! if they ask for “how much variance in Y is explained by…” ALWAYS write down R square, not R
! the F test is only for ANOVA & multiple regression analysis, if they ask if X is a significant predictor of Y, always report t value!
! when reporting variance uniquely explained, report “part” value SQUARED!
Overview of the standardized residuals (to analyze if there are any outliers): ANALYZE > DESCRIPTIVE
STATISTICS > DESCRIPTIVES > ADD “Standardized residuals”, “Leverage” and “Cook’s d”
- interpret based on outlier diagnostics
! this only works if in the regression analysis you select Cook’s d and the others from the “SAVE” tab
Hierarchical regression analysis: ANALYZE > REGRESSION > LINEAR > select dependent variable > add
predictors from the first block > NEXT > add predictor from the second block (you only need to add the
new one) > NEXT & so on
- STATISTICS… - request r square change, CI etc.
! always reset your regression before doing a new one on the same dataset, because otherwise SPSS will also give you the plots
& other stuff you asked for beforehand
- DF for testing a predictor in one of the blocks is N-p-1, but p is number of predictors in THIS model, not overall!!