,Sample space : set of all possible outcomes
Event : any collection of outcomes in the sample space
Both Tasks : Min Mxn and
-
-
O EP ( A) El
sum of all of the prob .
possible -
- I , MAI I -
-
Complement Rule: PLAY I PLA)
-
-
-
Independent: knowing that event A occurs x change prob . of Event B
PLA and B) = PLA) x PCB )
Mutually Exclusive (Disjoint) Event : A and B have no outcomes in common
PCA and 131=0
② Not Independent
At least :P ( at least I -
-
I -
PIN one ) Pl at least O ) -
-
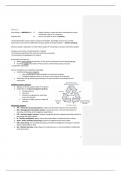
PCA or B )
PLA or B) -
-
PLA) t PCB) -
PCA and B)
Independent : PLA or B) PLAIT PCB) PCAIXPIB) -
-
-
Mutually Exclusive PLA or BI Platt PIB) :
-
-
Plan B)
NAIB) =
PCB)
sample space : B
Independent : Pl Al BI PCA)
-
-
P ( BIA )
-
- PCB)
, Lesson 1
-
XPL03NG7A
Individuals and Variables
1. Individual chat
② object described by set of data exlppl animals , things
,
2. Variable
to characteristics of an individual
-
takes different values for different individuals
1) Quantitative : takes numerical values ex) height , weight GPA,
2) Categorical ( qualitative ) : places individual into one of categories breed of dog
an
engender , hair color ,
Distribution of available
-
Distribution : what values the variable takes
clustered together
a.
spread far apart
) how
-
these values vary
1. Distribution of categorical Value
" Bar
Graph 2) Pie Graph
7%1
percentile ' IEIEH
2. Distribution of Quantitative Variable sum
p
(I
1) Dotplot 4) Relative cumulative frequency Graph ( Ogive)
-
Describe relative position of individual within distribution lpth percentile )
-
"
goth percentile " -
-
90% <
your score ,40% of all scores
- E' EEE
'
-
ogive
Stem plot
§f!! o ÷
- - - -
2) heat
-
,
is:i
5) Boxplot
outlier
3)
Histogram 1. range It i.
sxiarfmqxfizi Not show :
→ Qf 99 1) Mean Only media
0 IQR -1 Q2 -
1-87%87-1042
.°r¥#
QI
-
14 ' 2) Number of Observations
1.5×1042--2 '
.
how many data
Horizontal
r
og
( normal dis
(
Vertical
outlier
1-131-1
mind 'meaa!
ma '
.
,
, Pattern of Distribution
1) Shape / symmetry vs skewness )
2) Outliers / extreme values : Min -
1.5×1042 ,
Max -11.5×10421
3) Center lmeanvs median )
4) Spread / range , lnterquartile Range)
Skewed Distribution Skewed Left Skewed Right
-¥ ¥
1) Skewed Right :
-
rel cumulative
.
frequency graph increase rapidly in beginning mean -
mean
2) Skewed Left :
-
rel cumulative
.
frequency graph increase rapidly atend
Describing Destributions with Numbers
1) Mean
2) Median
3) Range / Max Mint
-
4) IQR / Inter quartile Range :Q3 -
Q1 )
5) Five Number Summary / Min ,Ql,Med,Q3 ,
Max )
b) Outliers ( Max -11.51042 Min ,
-
1.5 / QR
Center of Distribution normal
Comparing Mean and Median
# §:X
1) Mean of 1) Symmetric mean median
m¥¥
: :
:[ = ,
sum
nofobserv .
2) Skewed left : means median
_aean
most popular measure of center
-
3) Skewed Right : mean > median
-
sensitive to outliers → Not appropriate measure
-
mean pulled towards skewness Linear Transformation
* 2) Median / Q2 50th percentile) ,
-
X mean µ
:
, standard deviation o
"
Mem
:Ñ,Ñ
' '
-
Odd :( ntlllzth Mean
-
Even : average of nlzthandlnlztlltn o +1 ICHI sp :S , 0
Eat
-10
-
Sigma
Joliet
-
spread of Distribution ¥iÉ¥ -
1)
Range : Max -
Min deviation x :{1123.4.5 }
/
:|
2) IQR :Q } -
Q1 "
" "
s
** 3) Standard Deviation 1. Y=atX 2. Y=bx
*
-
most common measure of spread Tdegreeof freedom
y=2 -11=[3,4%6,7] y=3x={3,619,12115}
close link with mean
=Fv=Elxin2 My=2tMx My=3µx=9
-
→ sensitive to outliers HE -24Mt -1s oy=ox oy=3ox
É
Degree of freedom
¥?
Intinction Point
⇒=om=÷÷÷÷÷:÷¥÷✗¥÷÷÷÷÷;
"
" 2/1 Gi -12/1 fn÷Éñ2
(
-
datatnean É '
n ,µQ -1--1--1-11=0 - Tfixed ✓ conceived
3tF.sc
" "
'THE change
'
h l
'
mean
@Nio -10
-
Properties of standard Deviation " 3. katbx
'
"°=
"
-
measure spread or dispersion around mean y=2t3x=[518111,131171
-
same mean :tspread,T standard deviation →
My=2t3µx=11
,, , ' 00
-
all same values : standard deviation __
O oy=3ox
Event : any collection of outcomes in the sample space
Both Tasks : Min Mxn and
-
-
O EP ( A) El
sum of all of the prob .
possible -
- I , MAI I -
-
Complement Rule: PLAY I PLA)
-
-
-
Independent: knowing that event A occurs x change prob . of Event B
PLA and B) = PLA) x PCB )
Mutually Exclusive (Disjoint) Event : A and B have no outcomes in common
PCA and 131=0
② Not Independent
At least :P ( at least I -
-
I -
PIN one ) Pl at least O ) -
-
PCA or B )
PLA or B) -
-
PLA) t PCB) -
PCA and B)
Independent : PLA or B) PLAIT PCB) PCAIXPIB) -
-
-
Mutually Exclusive PLA or BI Platt PIB) :
-
-
Plan B)
NAIB) =
PCB)
sample space : B
Independent : Pl Al BI PCA)
-
-
P ( BIA )
-
- PCB)
, Lesson 1
-
XPL03NG7A
Individuals and Variables
1. Individual chat
② object described by set of data exlppl animals , things
,
2. Variable
to characteristics of an individual
-
takes different values for different individuals
1) Quantitative : takes numerical values ex) height , weight GPA,
2) Categorical ( qualitative ) : places individual into one of categories breed of dog
an
engender , hair color ,
Distribution of available
-
Distribution : what values the variable takes
clustered together
a.
spread far apart
) how
-
these values vary
1. Distribution of categorical Value
" Bar
Graph 2) Pie Graph
7%1
percentile ' IEIEH
2. Distribution of Quantitative Variable sum
p
(I
1) Dotplot 4) Relative cumulative frequency Graph ( Ogive)
-
Describe relative position of individual within distribution lpth percentile )
-
"
goth percentile " -
-
90% <
your score ,40% of all scores
- E' EEE
'
-
ogive
Stem plot
§f!! o ÷
- - - -
2) heat
-
,
is:i
5) Boxplot
outlier
3)
Histogram 1. range It i.
sxiarfmqxfizi Not show :
→ Qf 99 1) Mean Only media
0 IQR -1 Q2 -
1-87%87-1042
.°r¥#
QI
-
14 ' 2) Number of Observations
1.5×1042--2 '
.
how many data
Horizontal
r
og
( normal dis
(
Vertical
outlier
1-131-1
mind 'meaa!
ma '
.
,
, Pattern of Distribution
1) Shape / symmetry vs skewness )
2) Outliers / extreme values : Min -
1.5×1042 ,
Max -11.5×10421
3) Center lmeanvs median )
4) Spread / range , lnterquartile Range)
Skewed Distribution Skewed Left Skewed Right
-¥ ¥
1) Skewed Right :
-
rel cumulative
.
frequency graph increase rapidly in beginning mean -
mean
2) Skewed Left :
-
rel cumulative
.
frequency graph increase rapidly atend
Describing Destributions with Numbers
1) Mean
2) Median
3) Range / Max Mint
-
4) IQR / Inter quartile Range :Q3 -
Q1 )
5) Five Number Summary / Min ,Ql,Med,Q3 ,
Max )
b) Outliers ( Max -11.51042 Min ,
-
1.5 / QR
Center of Distribution normal
Comparing Mean and Median
# §:X
1) Mean of 1) Symmetric mean median
m¥¥
: :
:[ = ,
sum
nofobserv .
2) Skewed left : means median
_aean
most popular measure of center
-
3) Skewed Right : mean > median
-
sensitive to outliers → Not appropriate measure
-
mean pulled towards skewness Linear Transformation
* 2) Median / Q2 50th percentile) ,
-
X mean µ
:
, standard deviation o
"
Mem
:Ñ,Ñ
' '
-
Odd :( ntlllzth Mean
-
Even : average of nlzthandlnlztlltn o +1 ICHI sp :S , 0
Eat
-10
-
Sigma
Joliet
-
spread of Distribution ¥iÉ¥ -
1)
Range : Max -
Min deviation x :{1123.4.5 }
/
:|
2) IQR :Q } -
Q1 "
" "
s
** 3) Standard Deviation 1. Y=atX 2. Y=bx
*
-
most common measure of spread Tdegreeof freedom
y=2 -11=[3,4%6,7] y=3x={3,619,12115}
close link with mean
=Fv=Elxin2 My=2tMx My=3µx=9
-
→ sensitive to outliers HE -24Mt -1s oy=ox oy=3ox
É
Degree of freedom
¥?
Intinction Point
⇒=om=÷÷÷÷÷:÷¥÷✗¥÷÷÷÷÷;
"
" 2/1 Gi -12/1 fn÷Éñ2
(
-
datatnean É '
n ,µQ -1--1--1-11=0 - Tfixed ✓ conceived
3tF.sc
" "
'THE change
'
h l
'
mean
@Nio -10
-
Properties of standard Deviation " 3. katbx
'
"°=
"
-
measure spread or dispersion around mean y=2t3x=[518111,131171
-
same mean :tspread,T standard deviation →
My=2t3µx=11
,, , ' 00
-
all same values : standard deviation __
O oy=3ox