Statistics and data science 188 Organising and visualizing variables
Chapter 2
Introduction
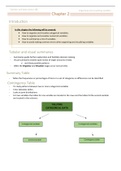
In this chapter the following will be covered:
• How to organise and visualise categorical variables.
• How to organise and visualise numerical variables.
• How to summarise a mix of variables.
• How to avoid making common errors when organising and visualising variables.
Tabular and visual summaries
- Summaries guide further exploration and facilitate decision making
- Visual summaries enable rapid review of larger amounts of data
o and show possible patterns
- Often the Organise and Visualize stages occur concurrently
Summary Table
- Tallies the frequencies or percentages of items in a set of categories so differences can be identified
-
Contingency Table
- To study patterns between two or more categorical variables
- Cross tabulates tallies
- Looks at joint distributions
- For two variables the tallies for one variable are located in the rows and the tallies forthe second variable
are located in the columns.
TALLYING
CATEGORICAL DATA
1 categorical variable 2 categorical variables
Summary table Contingency table
, Visual summaries
enable rapid review of larger
amounts of data show
possible significant patterns.
VISUALISING
CATEGORICAL DATA
Summary table for 1
categorical variable
o Bar Chart
o Has gaps (vs no gaps in a histogram)
o Is easiest to understand for the average person
o Pareto Chart
o To display categorical data on a nominal scaleA vertical bar chart
• Categories are shown in descending order of frequency
o A cumulative polygon is shown in the same graph
Chapter 2
Introduction
In this chapter the following will be covered:
• How to organise and visualise categorical variables.
• How to organise and visualise numerical variables.
• How to summarise a mix of variables.
• How to avoid making common errors when organising and visualising variables.
Tabular and visual summaries
- Summaries guide further exploration and facilitate decision making
- Visual summaries enable rapid review of larger amounts of data
o and show possible patterns
- Often the Organise and Visualize stages occur concurrently
Summary Table
- Tallies the frequencies or percentages of items in a set of categories so differences can be identified
-
Contingency Table
- To study patterns between two or more categorical variables
- Cross tabulates tallies
- Looks at joint distributions
- For two variables the tallies for one variable are located in the rows and the tallies forthe second variable
are located in the columns.
TALLYING
CATEGORICAL DATA
1 categorical variable 2 categorical variables
Summary table Contingency table
, Visual summaries
enable rapid review of larger
amounts of data show
possible significant patterns.
VISUALISING
CATEGORICAL DATA
Summary table for 1
categorical variable
o Bar Chart
o Has gaps (vs no gaps in a histogram)
o Is easiest to understand for the average person
o Pareto Chart
o To display categorical data on a nominal scaleA vertical bar chart
• Categories are shown in descending order of frequency
o A cumulative polygon is shown in the same graph